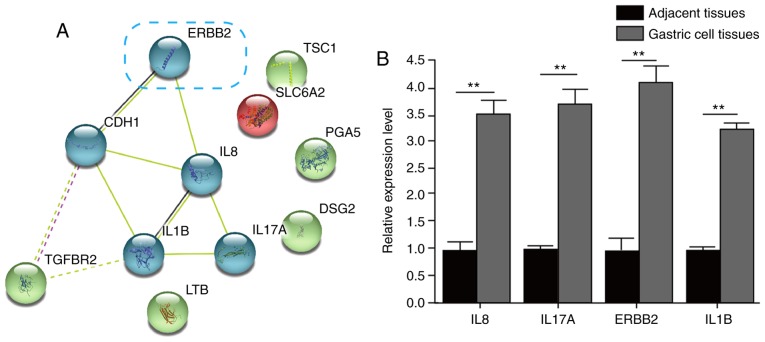
Figure 2.
STRING analysis of the cluster of GC-related genes. (A) Gene-gene interaction analysis of the GC-related genes was performed via the STRING website and clustered using k-means. The association graph, with ERBB2, CDH1, IL1B, IL8, IL17A and TGFBR2 as the core, was formed. (B) mRNA levels of ERBB2, IL1B, IL8 and IL17A in adjacent tissues and GC tissues. **P<0.01 vs. adjacent tissue. STRING, Search Tool for the Retrieval of Interacting Genes/Proteins; gc, gastric cancer; ERBB2, epidermal growth factor receptor 2; CDH1, cadherin 1; IL, interleukin; TGFBR2, transforming growth factor-β receptor 2; TSC1, tuberous sclerosis 1; SLC6A2, solute carrier family 6 member 2; PGA5, pepsinogen 5, group I (pepsinogen A); DSG2, desmoglein 2; LTB, lymphotoxin β.

