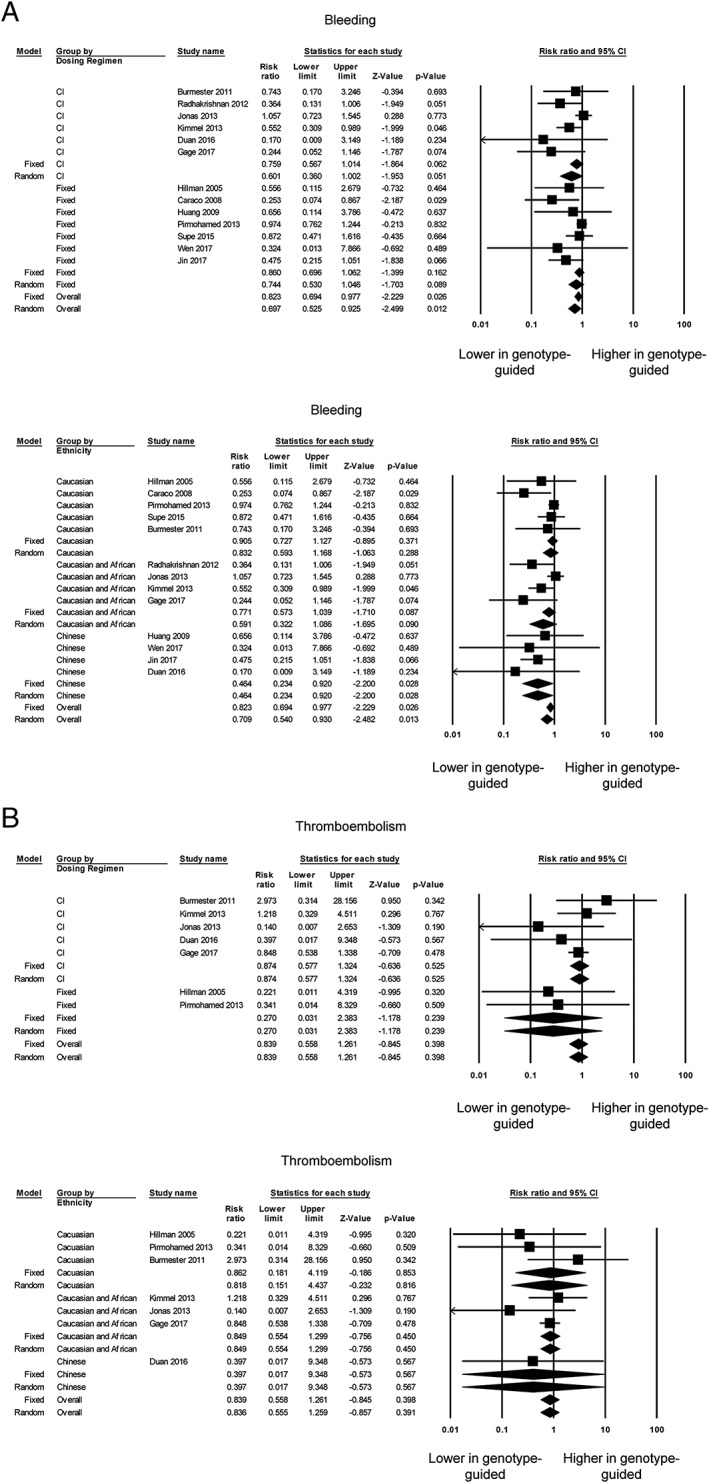
Figure 4.

Panel A shows the risk ratios for comparing the number of individuals with bleeding symptoms between the genotype‐guided warfarin dosing and conventional dosing groups based on the control group dosing regimen (top) or ethnicity (bottom). Panel B shows the risk ratios for comparing the number of individuals with thromboembolism, based on the control group dosing regimen (top) or ethnicity (bottom). CI, confidence interval
