Figure 1.

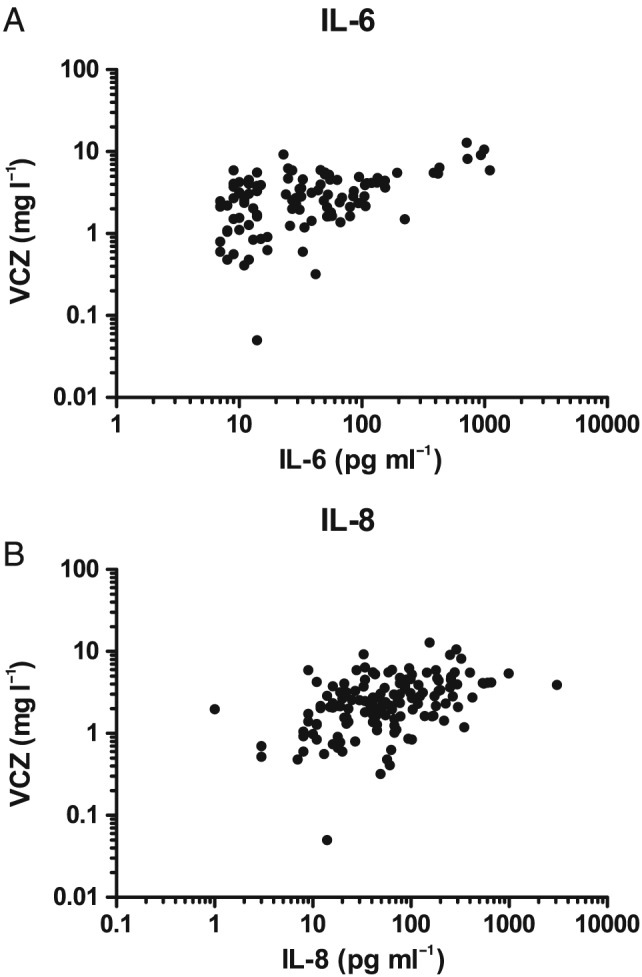
(A) Voriconazole (VCZ) concentrations (mg l–1) vs. interleukin (IL) 6 (pg ml–1) levels. (B) VCZ (mg l–1) vs. IL‐8 levels (pg ml –1)

(A) Voriconazole (VCZ) concentrations (mg l–1) vs. interleukin (IL) 6 (pg ml–1) levels. (B) VCZ (mg l–1) vs. IL‐8 levels (pg ml –1)