
Figure 3.
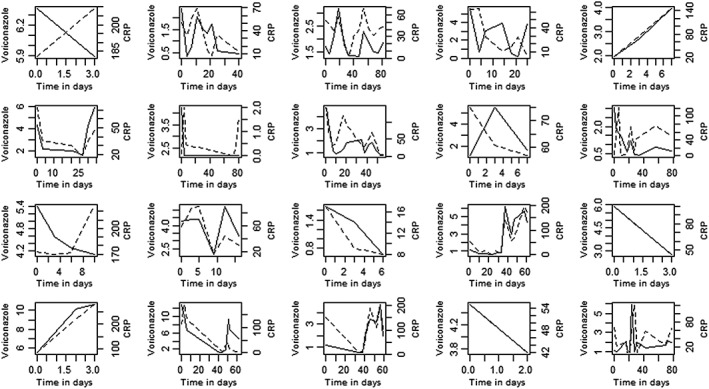
Voriconazole (VCZ) concentrations (mg l–1) (dotted line) and C‐reactive protein (CRP) levels (mg ml–1) (continuous line) vs. time (days) of VCZ treatment per individual patient (two patients were excluded because absence of repeated measurements over time)