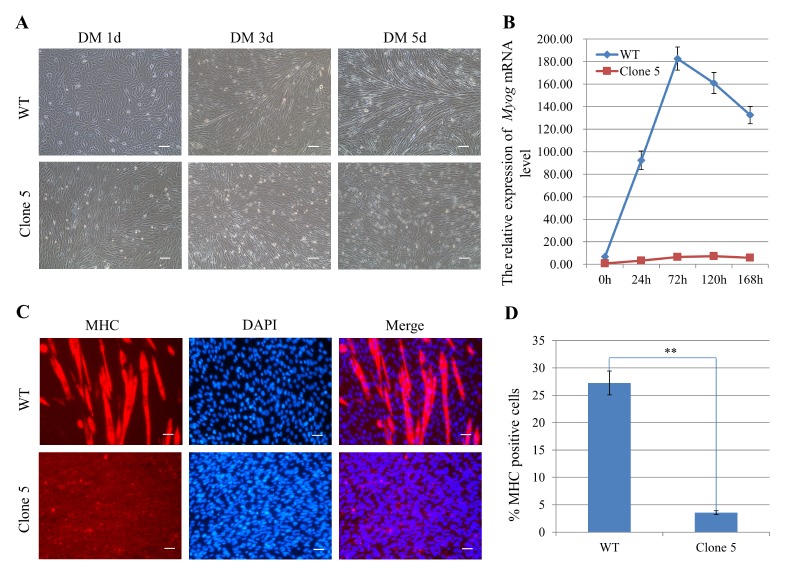
Fig. 4.
Myogenesis is impaired in clone 5 myoblasts. (A) Myotube formation was disrupted in clone 5 cells. Myogenesis in WT control and clone 5 was induced by culturing in medium containing 2% horse serum. Scale bar = 100 μm. (B) qRT-PCR analysis for myoblast differentiation showed lower Myog in clone 5 compared to the WT control. (C) The clone 5 and WT control were induced to differentiate and immunostained for MHC (red) and DAPI (blue) at 5 days after differentiation. Scale bar =100 μm. (D) Graph illustrating the percentage of MHC-positive cells per field of vision in Fig. 4C as the differentiation index. Data are presented as the mean ± s.d., n = 3. **P < 0.01

