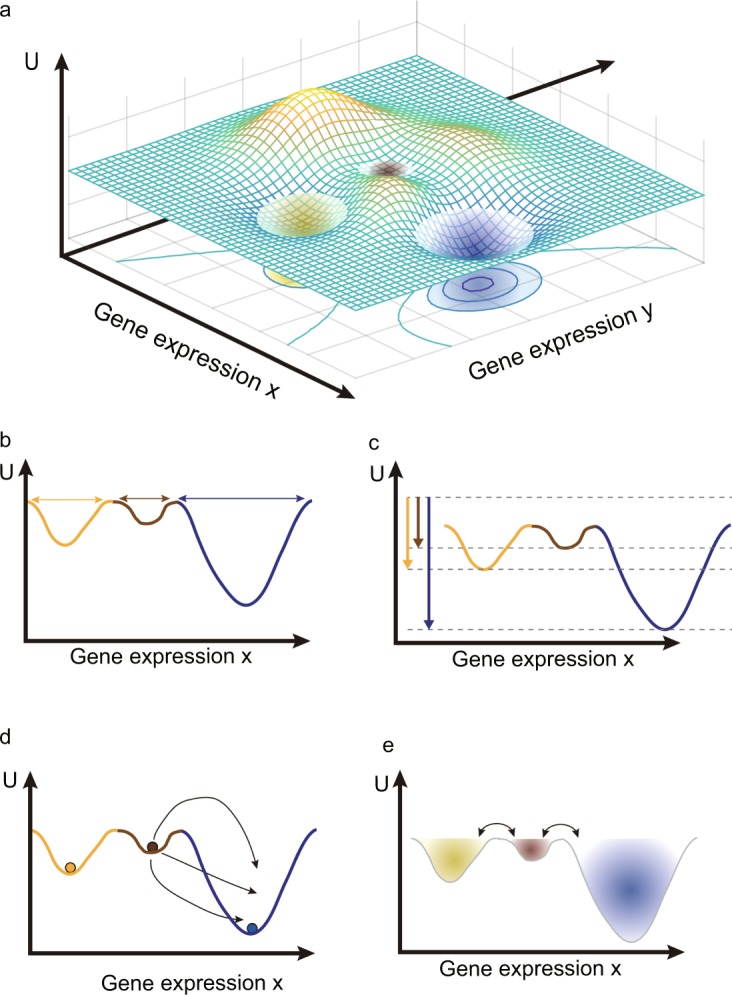
Figure 1.

The scheme of quasi-potential landscape and relative dynamic stability. (a) A three-dimensional quasi-potential landscape. A point of XY plane is corresponding to a gene expression state of cell and elevations of each point U(x, y) represent the quasi-potential. Three attractors are local minimums in the quasi-potential landscape. (b–e) are schematic descriptions of four different methods to calculate the relative dynamic stability of the attractors. For clarity, we used two-dimensional representation of the quasi-potential landscape. (b) The relative dynamic stability is defined by the basin size. (c) The dynamic stability is defined by the steady state probability distribution function. (d) The dynamic stability is defined by the mean first passage time. (e) The relative dynamic stability is defined by the basin transition rate.
