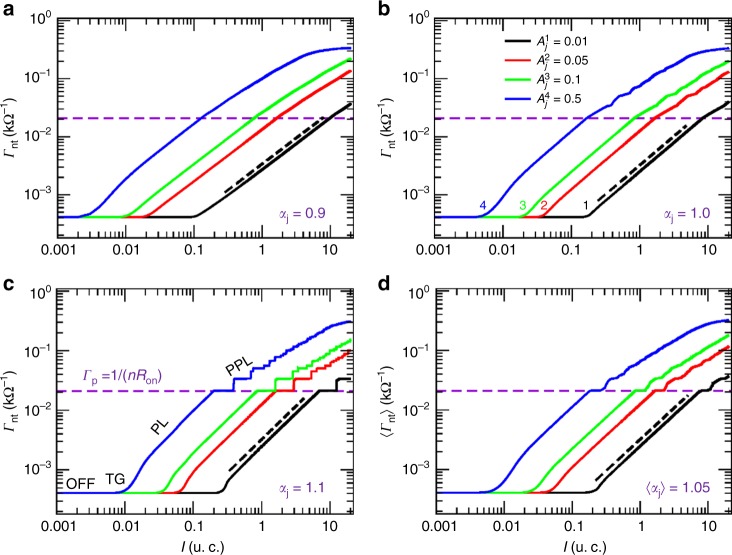
Fig. 2.
Conductance versus current plots taken for an image processed Ag nanowire network. The network wire-density is of 0.49 wires/μm2 and its scanning electron microscopy image plus its stick/graph representation can be found in the Supplementary Figure 7. Currents are expressed in units of current (u.c.). The results were taken for distinct values of exponents: a , b , c , and d . In the latter, a narrow dispersion was induced in the exponents using a normal distribution with , σ = 0.1 and truncated at . Each panel contains four curves, one for each Aj value specified on the legend in panel b. Numbers “1,2,3,4” on panel b label the curve to its corresponding Aj. The same labelling scheme and order of the curves hold for all panels. Dashed lines illustrate the power-law fittings that determined . Results for all fittings are presented on Table 1. Horizontal dashed lines mark the conductance of the first path formed in the network containing n junctions at their optimal state Ron. This conductance level is given by and for this particular network, n = 4. A distinction between the four transport regimes discussed on the main text is depicted on panel c: (OFF) OFF-threshold, (TG) transient growth, (PL) power law, and (PPL) post-power-law

