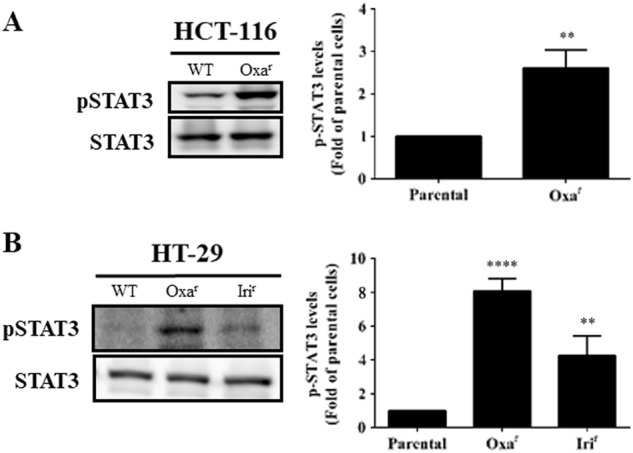
Fig. 1. Detection of active STAT3 levels in drug-resistant HCT-116 and HT-29 cells.

Total lysates (30 μg) were prepared from a parental (WT) and oxaliplatin-resistant HCT-116 cells as well as b parental, oxaliplatin-resistant, and irinotecan-resistant HT-29 cells and subjected to western blot analyses using primary antibodies against phospho-specific STAT3 (Tyr705, pSTAT3) and regular STAT3 (loading control). Data (right panels) are the mean ± SD of three independent experiments. *p < 0.05, **p < 0.01, ***p < 0.005, and ****p < 0.001 compared with parental cells by Student’s t-test
