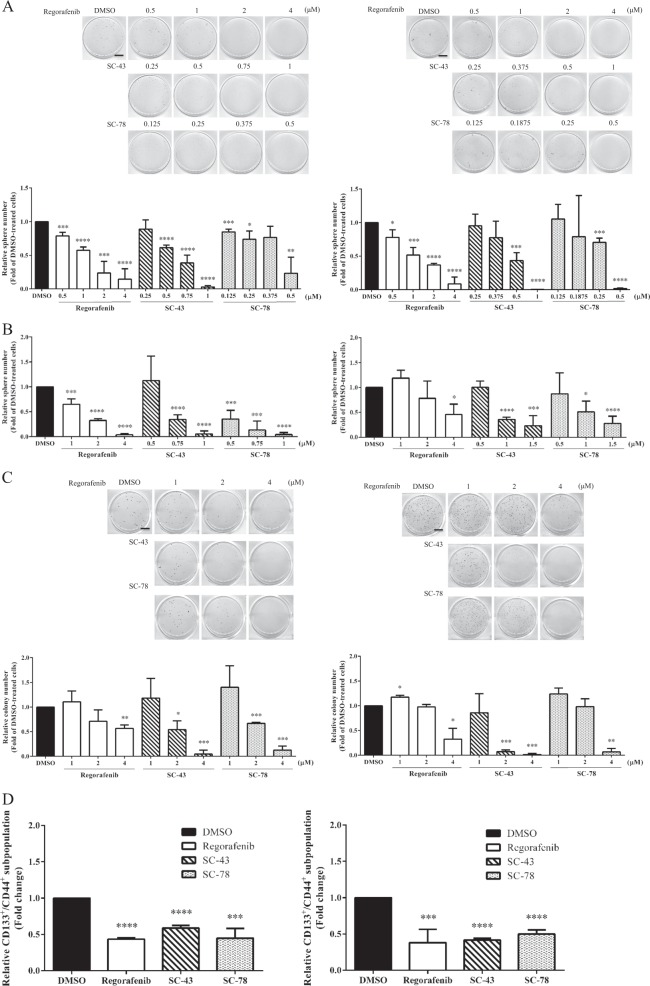
Fig. 3. Effects of regorafenib, SC-43, and SC-78 on the stemness properties of HCT-116 and HT-29 cells.
a HCT-116 (top) and HT-29 (bottom) cells (1 × 10⁵) were cultured in defined media with DMSO (vehicle) or different doses of regorafenib (0.5, 1, 2, and 4 µM), SC-43 (0.25, 0.5, 0.75, and 1 µM for HCT-116; 0.25, 0.375, 0.5, and 1 µM for HT-29), and SC-78 (0.125, 0.25, 0.375, and 0.5 µM for HCT-116; 0.125, 0.188, 0.25, and 0.5 µM for HT-29). After 7 days, spheres stained by MTT were photographed (scale bar = 0.7 cm), and their numbers were quantified by MetaMorph software. Data are the mean ± SD of three independent experiments. b HCT-116 (left) and HT-29 (right) cells (1 × 10⁵) cultured in defined media for 5 days were treated with DMSO or different doses of regorafenib (1, 2, and 4 µM), SC-43 (0.5, 0.75, and 1 µM for HCT-116; 0.5, 1, and 1.5 µM for HT-29), and SC-78 (0.5, 0.75, and 1 µM for HCT-116; 0.5, 1, and 1.5 µM for HT-29) for another 7 days. The sphere number was quantified. c HCT-116 (top) (1 × 10³/well) and HT-29 (bottom) (2 × 10³/well) cells were cultured in 0.3% agar containing DMSO (vehicle) or different doses (1, 2, and 4 µM) of regorafenib, SC-43, and SC-78. After 20 days, colonies stained by MTT were photographed (scale bar = 0.7 cm), and their numbers were quantified by MetaMorph software. d HCT-116 (left) and HT-29 (right) cells were treated with DMSO or 4 μM of regorafenib, SC-43, and SC-78 for 48 h. The percentage of the CD133+/CD44+ subpopulations of each sample was determined by flow cytometry after the cells were incubated simultaneously with PE-conjugated anti-CD133 and FITC-conjugated anti-CD44 antibodies. Data are the mean ± SD of three independent experiments. *p < 0.05, **p < 0.01, ***p < 0.005, and ****p < 0.001 compared with DMSO-treated cells by Student’s t-test

