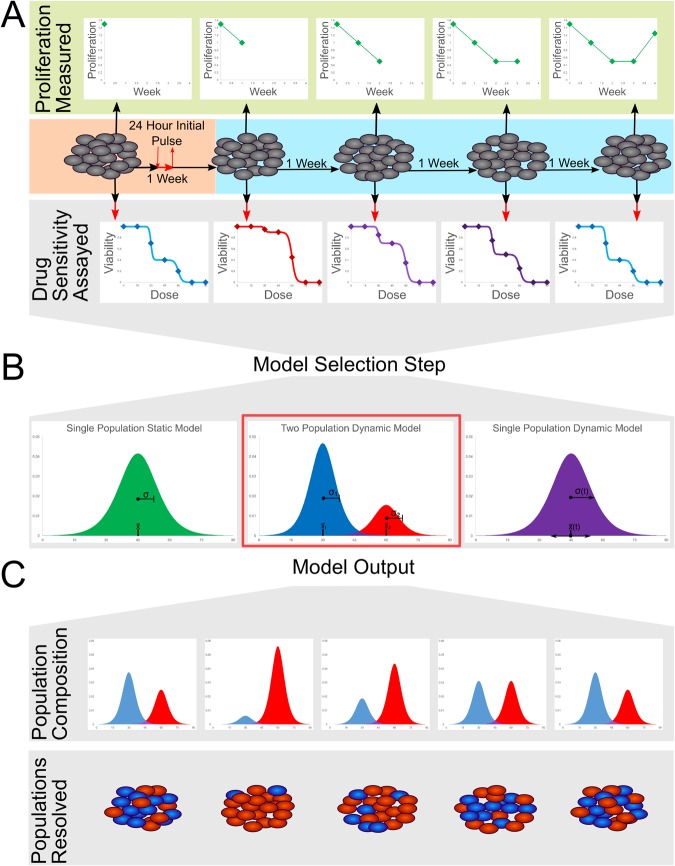
Figure 1.
Experimental and modeling workflow: (a) MCF-7 breast cancer cells are treated with an initial pulse of doxorubicin (500 nM) for 24 hours. After treatment, the instantaneous growth rate is measured at each week. However, the subpopulation composition of drug sensitive and resistant cells is not easily identifiable from any single biomarker, as is indicated by the gray cells. To quantify the changes in drug resistance as the population responds to treatment, a subset of cells are extracted each week and a drug sensitivity assay is performed. (b) Using the combined data set containing a drug sensitivity assay at each time point, multiple mathematical models are tested to determine the optimal method for capturing the dynamic response of the cell population. Model selection statistics indicate that a multi-population model of at least two subpopulations is the optimal model. (c) The dynamic two population model estimates the presence of two subpopulations with distinct LD50s and variances corresponding to a sensitive and resistant subpopulation. The model mandates that these states remain constant throughout drug response, with the changes in drug sensitivity of the whole population resulting from changes in the proportions of the areas under the curve of the sensitive versus the resistant population. The model reveals the composition of resistant and sensitive subpopulations at each time point, as is indicated schematically by the ability to identify the proportions of red and blue cells in the population at each week.

