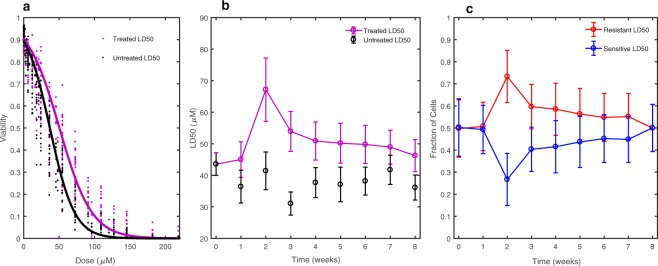
Figure 2.
Time-resolved drug sensitivity assays fit to multiple models: (a) The static single population model (solid lines in panel a) demonstrates that the average resistance of the 8 weeks of compounded drug sensitivity data significantly increases from an LD50 = 37.0 +/− 3.5 µM for the untreated to an LD50 = 50.4 +/− 2.4 µM following exposure to pulse-treatment of doxorubicin. (b) The LD50 estimates resulting from analysis with the dynamic single population model indicate that the increase in resistance is time-dependent, peaking at 2 weeks after treatment with an LD50 = 67.2 +/− 10.0 µM, followed by a slow return towards baseline resistance levels, reaching an LD50 = 46.4 +/− 5.1 µM at 8 weeks. (c) The two population dynamic model displays the model-estimated proportions of a population with LD50 = 79.7 +/− 6.5 µM (resistant) and a population with LD50 = 22.4 +/− 2.0 µM (sensitive). The relative proportions of these two populations change over time, yielding the observed LD50 for the overall population. In panels b and c, parameter fits at each time point are connected by a line for visual aid and the error bars represent the 95% confidence intervals on the parameter values using the bootstrapping method of replacement with n = 500.

