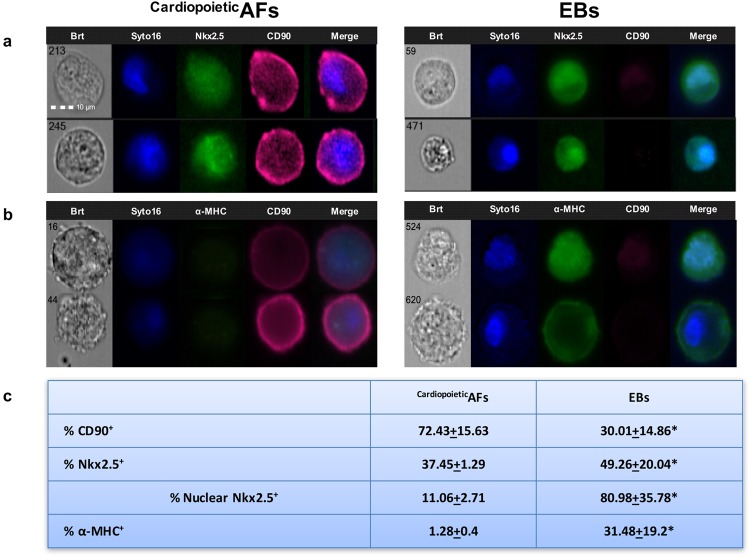
Figure 1.
Analysis of the cardiac potential of CardiopoieticAF cell-derived EBs. Representative ImageStream images of CardiopoieticAF and CardiopoieticAF cell-derived EB cells labeled with anti-CD90 (fuchsia)/anti-Nkx2.5 (green) (a) and with anti-CD90 (fuchsia)/anti-α-MHC (green) (b). Nuclei were counterstained with Syto16 (blue). Bars: 10 µm. (c) % of CD90+, Nkx2.5+, nuclear Nkx2.5+ and α-MHC + cells are expressed as the mean ± SD. *indicates values significantly different from CardiopoieticAF. Data are representative of seven independent experiments.

