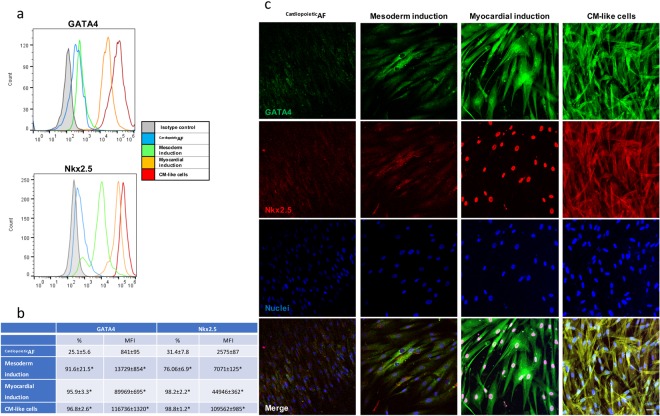
Figure 2.
Cytometric and immunofluorescent analyses of the expression and localization of the early cardiac markers GATA4 and Nkx2.5 during the different phases of the differentiation protocol. CardiopoieticAF: before the differentiation process; mesodermal induction: after 24 hrs of activin A and BMP4; myocardial induction: after 72 hrs of VEGF; cardiomyocytes: after 15 days of differentiation. (a) Flow cytometry histograms: gray line, isotype control; blue line, CardiopoieticAF; green line, mesodermal induction; yellow line, myocardial induction; red line, cardiomyocytes obtained after 15 days of differentiation. (b) % of positive cells and mean fluorescence intensity at each differentiation step. Data are expressed as the mean ± SD. (c) Immunofluorescent staining for GATA4 (green), Nkx2.5 (red) and nuclei (blue) during the different phases of the differentiation protocol. The bottom line shows the merged fluorescence, as indicated. Scale bar: 10 μm. Data are representative of seven independent experiments.

