Figure 3.
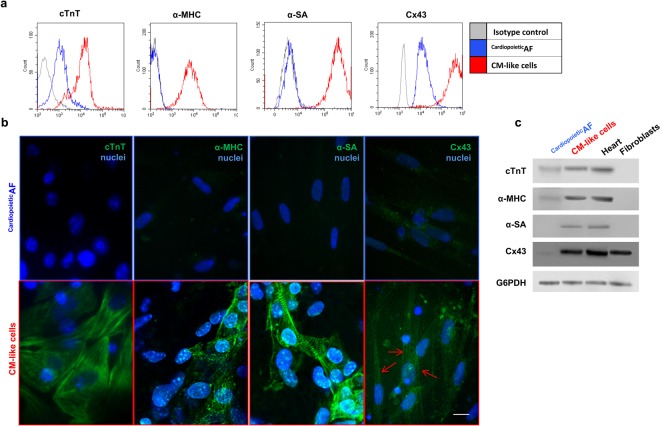
Detection of cTNT, α-MHC, α-SA and Cx43 in CardiopoieticAF cells and in CM-like cells obtained after 15 days of differentiation. (a) Flow cytometry analysis of TnT, α-MHC, α-SA and Cx43 in CardiopoieticAF cell (blue line) and CMs (red line). (b) Immunofluorescent staining for TnT, α-MHC, α-SA and Cx43 (green), as indicated. The nuclei are counterstained with DAPI (blue). Note the typical sarcomeric striations of α-SA. Red arrows indicate Cx43 localization on the cell membrane. Scale bar: 10 μm. (c) Western blot analysis of the cardiac markers. Human heart and fibroblast lysates were used as controls. The G6PDH lane is used as a loading control. Data are representative of seven independent experiments.

