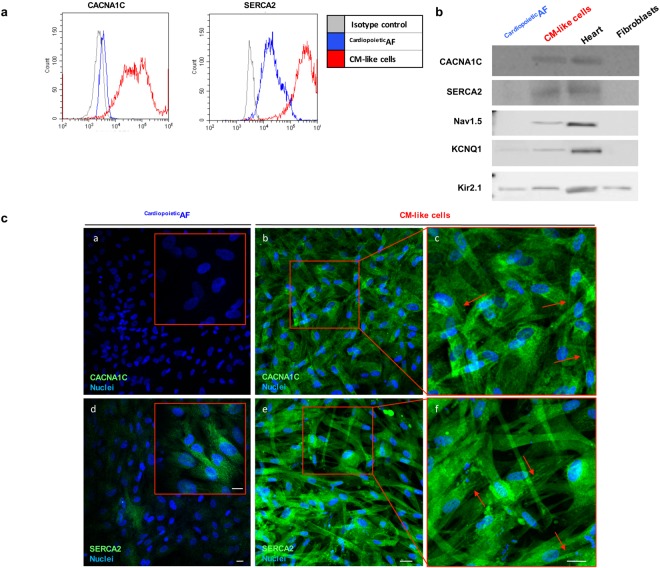
Figure 4.
Detection of calcium pumps CACNA1C and SERCA2 in CardiopoieticAF cells and in CM-like cells obtained after 15 days of differentiation. (a) Flow cytometry and (b) Western blot analysis for CACNA1C, SERCA2, Nav1.5, KCNQ1, Kir2.1 in CardiopoieticAF cells and CMs. In Western Blot human heart and fibroblast lysates were used as controls. In the histogram of the cytometric analysis, the gray line represents the isotype control, the blue line represents CardiopoieticAF cells and the red line represents CMs. (c) Immunofluorescent staining for CACNA1C and SERCA2 (green) in CardiopoieticAF cells (a and d) and in CMs (b–f). Inserts in a and d represent a higher magnification; the red squares in (b,e) are magnified in c and f. Nuclei are counterstained with DAPI (blue). Red arrows indicate the cell membrane localization of CACNA1C and the sarcoplasmic localization of SERCA2. Scale bar: 10 μm. Data are representative of seven independent experiments.

