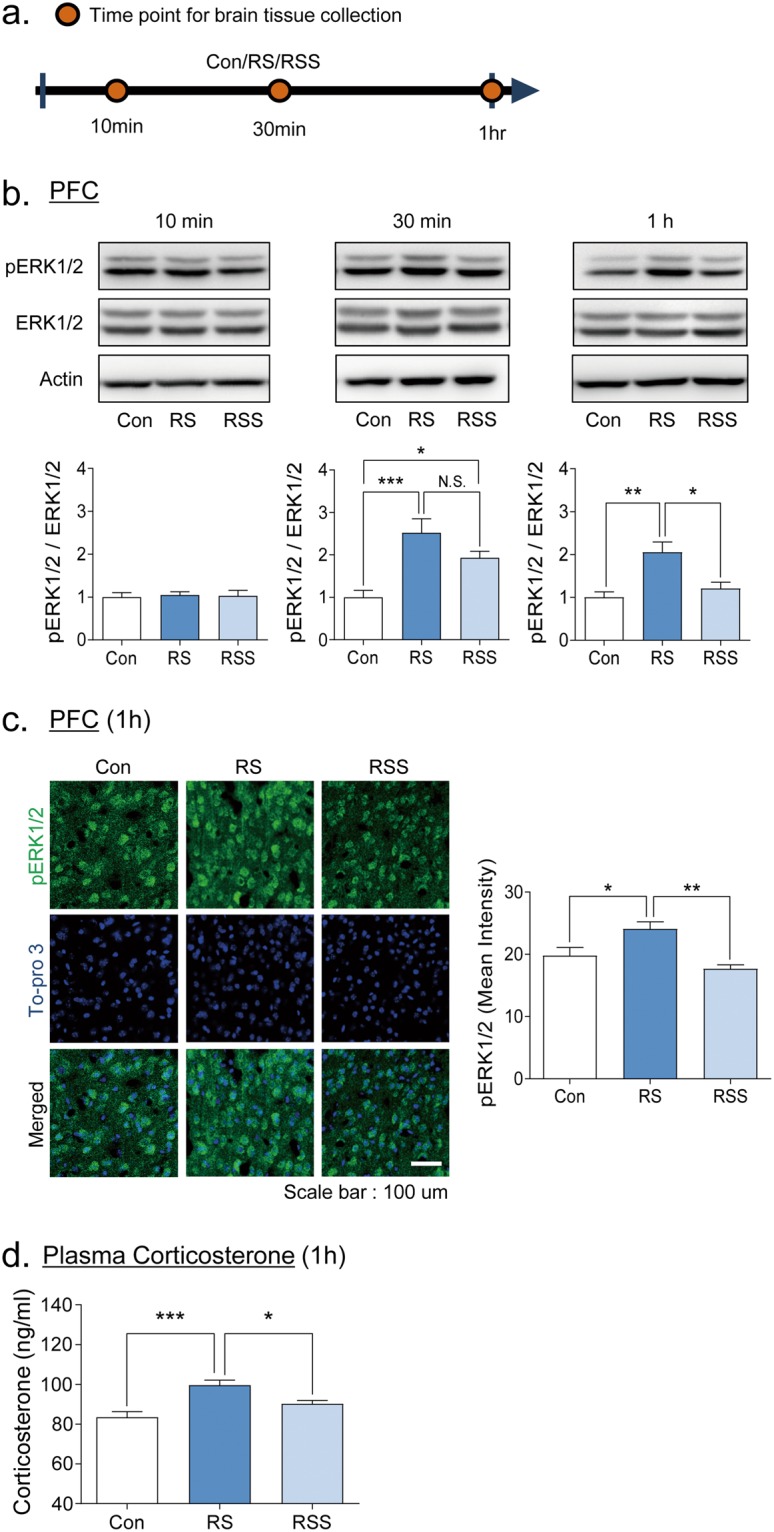
Figure 3.

Restraint-stress induced ERK1/2 activation in the prefrontal cortex is normalized by social interaction. (a) Scheme of brain tissue collection at three different restraint stress durations. The activation of ERK1/2 was measured in the prefrontal cortex after acute restraint stress using western blot (b) and immunohistochemistry (c). Western blot representative images cropped from separate sets of gels per time point and the corresponding quantitative graphs of ERK1/2-phosphorylation divided by ERK1/2 bands intensity (n = 5–6). Quantifications of pERK1/2/ERK1/2 bands were presented as the fold change normalized by band intensity of control group. ERK1/2 phosphorylation was significantly increased by 30 min or 1 h of restraint stress. (c) Immunohistochemistry images of layer 4 to 5 medial PFC and quantitative graph (n = 5). (d) Plasma corticosterone levels after 1 h of RS or RSS. All data are expressed as the mean ± S.E.M using bar graphs. All statistical analyses were performed using one-way ANOVA and Bonferroni’s multiple comparison post hoc analysis. *p < 0.05, **p < 0.01, ***p < 0.001. N.S.: no significance. Con: vehicle control group, RS: restraint stress group, RSS: restraint stress with social interaction group.
