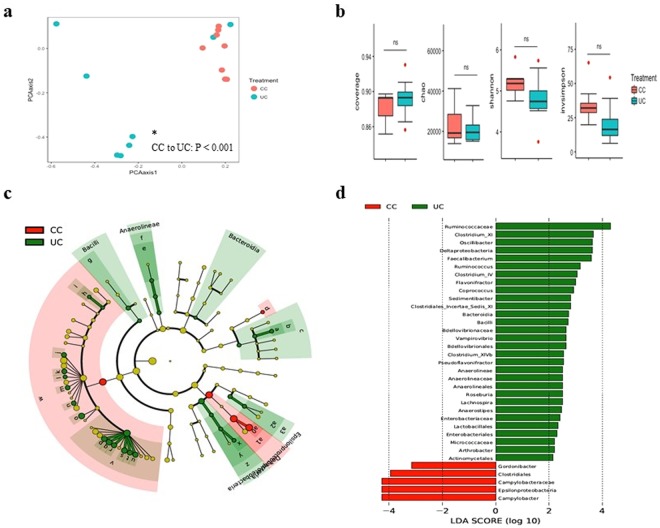
Figure 2.
Comparison of cecal microbiota of PBS-treated C. jejuni-challenged (CC) and unchallenged control (UC) chickens. (a) Non-metric multi-dimensional scaling (NMDS) plot illustrating the chicken cecal microbiota beta-diversity. (a*) Analysis of molecular variance (AMOVA) where p-values demonstrating significant differences in the NMDS plot, P < 0.05 was considered significant. (b) Alpha diversity analysis illustrating species richness and abundance. (c) LEfSe cladogram and (d) Linear discriminant analysis (LDA, horizontal bars) illustrating differential enrichment of microbes. Chickens of the CC group were treated orally at 14 days post-hatch with PBS as a placebo and were orally challenged with 107 CFUs of C. jejuni at 15 days post-hatch. At 22 days post-challenge with C. jejuni, chickens were necropsied and cecal contents were collected for analysis.

