Fig. 5.
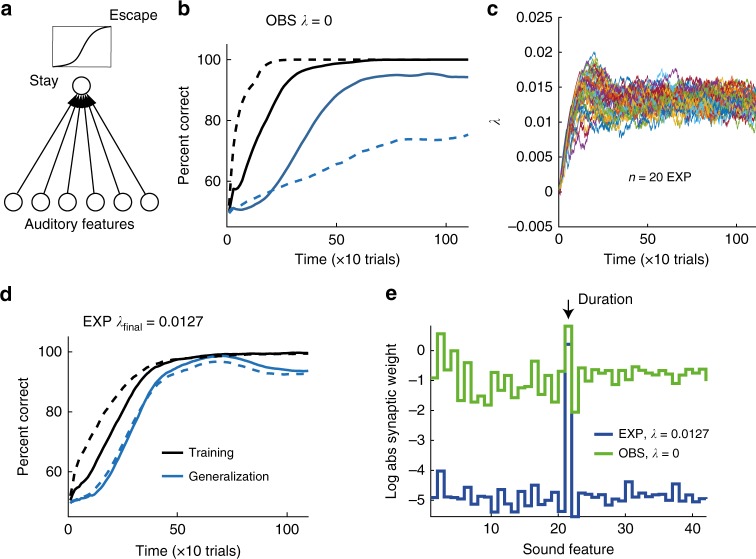
Regularization can explain the performance differences between experimenters and observers. a The model neuron triggers escapes from the perch based on the logistic response to a set (here 6) of auditory features. b When an ‘observer’ neuron responding to 42 auditory features is modeled without L1 regularization (λ = 0), the percent correct classification (PCC) on the training set (black line) increases rapidly but the PCC on the generalization set (blue line) increases much more slowly. Adding an extra 100 auditory features of frozen white noise (dashed lines) accentuates the contrast between fast learning and slow generalization. c The dynamics of the regularization penalty λ under the reward prediction error rule (each color is one simulation run, n = 20 simulated birds). d When the ‘experimenter’ neuron is trained with L1 regularization (with dynamic estimation of λ, the final value of λ (on average) = 0.0127), the curves reporting PCC on training and generalization sets increase slowly but at roughly matched rates. Increasing the number of frozen noise inputs by 100 has almost no effect on PCC curves (dashed lines). e In observer neurons, the log absolute synaptic weights (green) are roughly uniformly distributed. In experimenter neurons, the synaptic weights (blue) are all near zero except the weight corresponding to syllable duration (auditory feature 21, black arrow). Thus, the experimenter neuron turns into a duration detector. Curves show averages across 50 simulation runs. Features 23 onwards were frozen noise features

