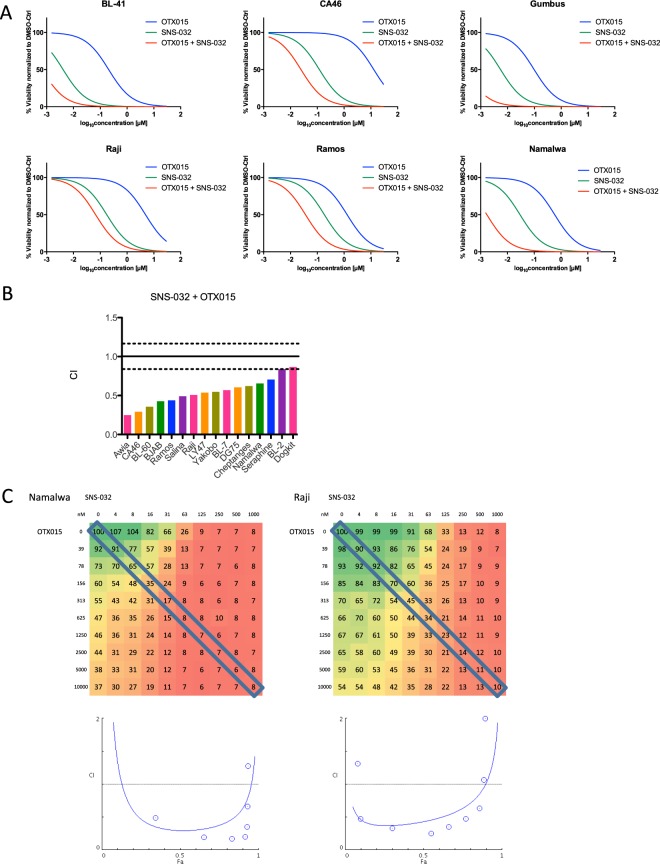
Figure 5.
BET and CDK2,7 and 9 inhibition work synergistically in BL. (A) Relative viability data indicates synergistic drug interactions between SNS-032 and OTX015. IC50 curves for OTX015 (blue) and SNS-032 (green) as single agents show lower toxicity compared to the IC50 of the combination of SNS-032 (in 10 concentrations) and OTX015 at 200 nM (red). (B) Boxplot of combination indices for SNS-032 and OTX015 in 18 cell lines. (C) Relative viability (%) data in a 10 × 10 matrix experiment (mean of duplicate values) for combinations of OTX015 with SNS-032. Drugs and respective concentrations are listed on x and y-axis. The effect on viability is colour coded (green high viability, red low viability). The diagonal box marks viability data used for constant-concentration-ratio analysis of drug interaction, which resulted in the Fa-CI plots (Fraction affected combination index35). We confirmed synergy in Namalwa and Raji using viability gradient in a 10 × 10 matrix and Fa-CI plots. For Namalwa most combination index values lay below the CI = 1 line, which indicates dose-dependent synergy of the combination of OTX015 and SNS-032. For Raji all data points lie below the horizontal line, which indicates strong synergy.

