
Figure 5.
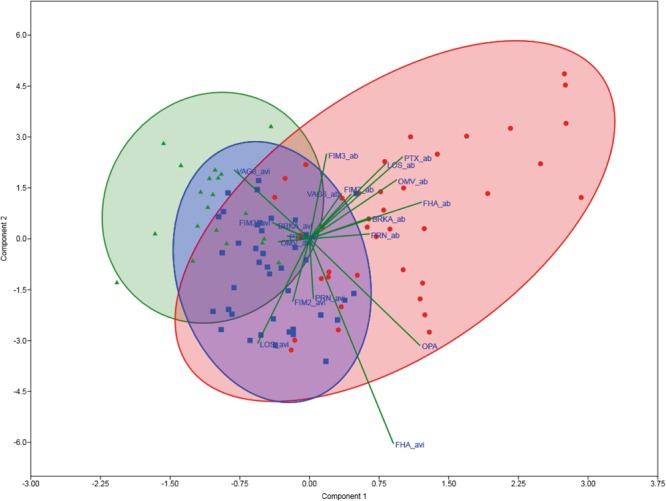
PCA of all obtained data. PCA was performed based on the antibody levels, AI and opsonophagocytosis indices for all plasma samples used in this study. The axes of differentiation of the antibody levels and AI are shown by the lines. Plasma samples collected from symptomatic patients are depicted as red dots, from recovered patients as blue squares and from controls as green triangles. The red, blue and green ellipses indicate clustering of the symptomatic, recovered and control samples, respectively. Lines indicate the axes of differentiation of the different parameters measured in this study.