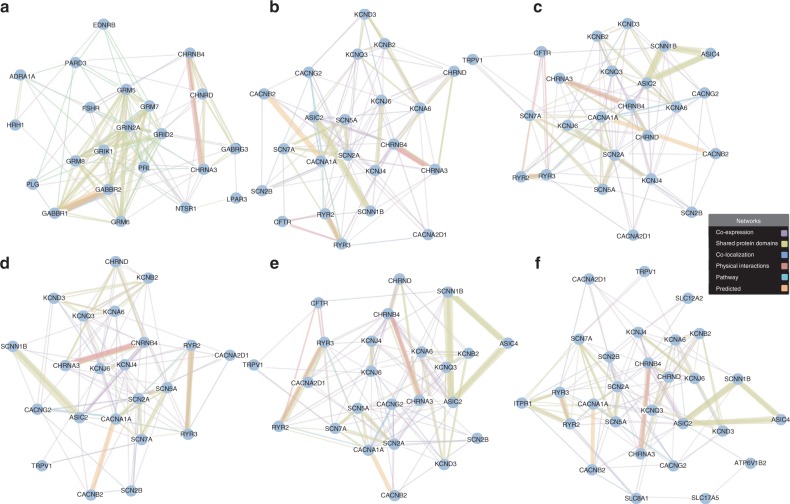
Fig. 2.
Gene network of the susceptibility pathways/GO terms. Each node is a gene, which was the selected gene in our GWAS pathway analysis and is shown in Supplementary Data 4. The connecting lines are drawn if the two genes have a relationship such as co-expression, shared protein domain, physical interactions, co-localization, or pathway. The thickness of the lines represents the degree of similarity between two genes. Gene network is produced using GeneMANIA. a The network of KEGG neuroactive ligand receptor interaction pathway consists of 23 genes and only TRPV1 in the associated gene list identified by our GWAS enrichment was shown no direct relationship with other associated genes. b The network of gated channel activity GO term consists all of 22 genes identified by our GWAS enrichment. c The network of ion channel activity GO term consists all of 24 genes identified by our GWAS enrichment. d The network of cation channel activity GO term consists all of 22 genes identified by our GWAS enrichment. e The network of substrate-specific channel activity GO term consists all of 24 genes identified by our GWAS enrichment. f The network of cation transmembrane transporter activity GO term consists 29 and only SLC4A4 in the associated gene list genes identified by our GWAS enrichment was shown no direct relationship with other associated genes

