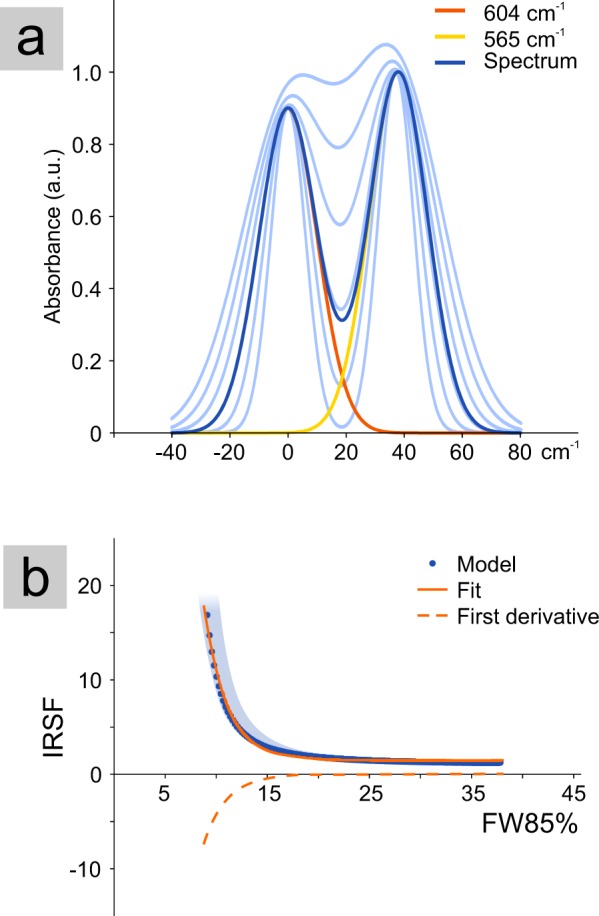
Figure 4.

(a) Simplified model of the ν4(PO4) vibrational mode representing the IR spectra (blue) resulting from the contribution of the 604 and 565 cm−1 peaks, approximated by Gaussian curves; in light-blue is represented the change of the spectrum shape by varying the width of the two Gaussian curves. (b) Plot of the calculated IRSF against the width at 85% of the height of the modelled peaks; an exponential regression function fits the calculated points (R2 = 0.996) and its first derivative shows the curve slope; the light blue area shows the variation range of IRSF and FW85% considering a possible shift of the two peaks centred position, resulting in a variation of the measured distance between the two maxima in the range 37–43 cm−1 (according to the experimental dataset).
