
Figure 5.
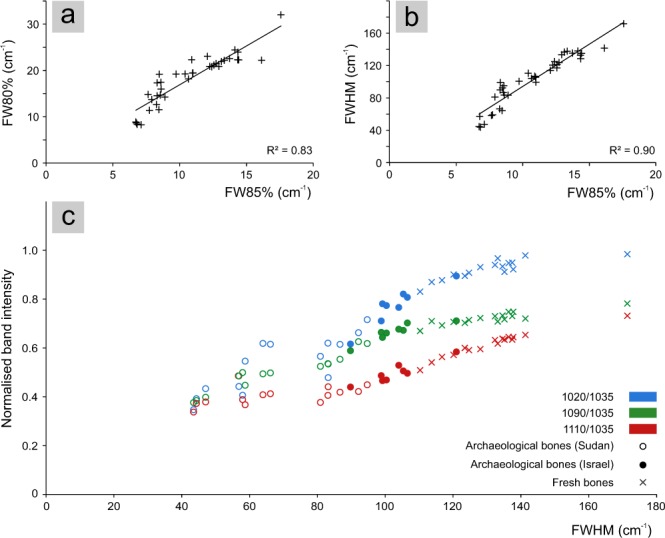
Plot showing the correlation between (a) the width at 80% of the height of the 565 cm−1 peak (FW80%) and the width at 85% of the height of the 604 cm−1 peak (FW85%); (b) the FWHM of the 1035 cm−1 peak and the width at 85% of the height of the 604 cm−1 peak (FW85%); (c) the variation of the 1020, 1090 and 1110 cm−1 bands normalised to the 1035 cm−1 band among all bioapatite samples. The relative standard deviation for these parameters is within 5%.