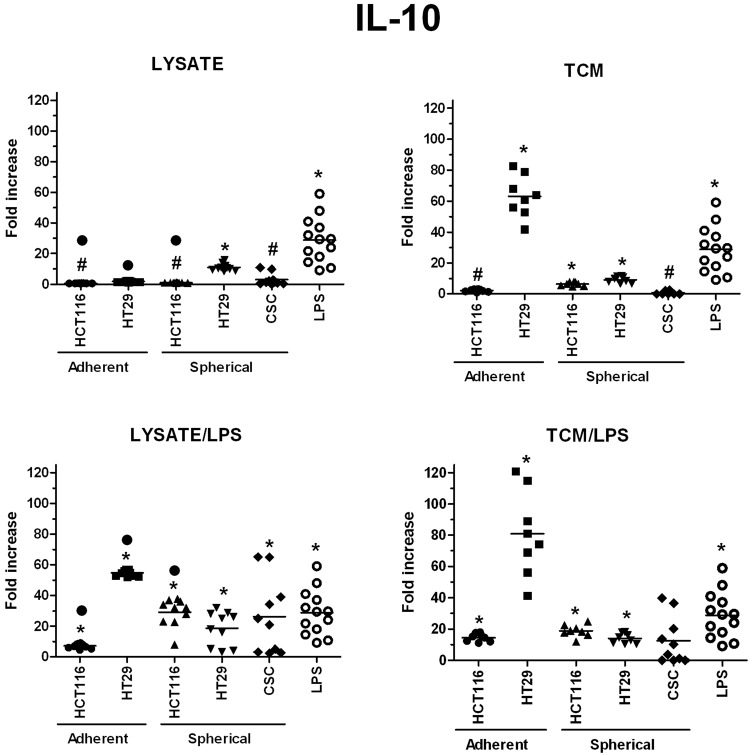
Figure 13.
The IL-10 concentration [pg/ml] in supernatants collected during the culture of stimulated DCs (n = 8–10). Data presented as fold change over the level obtained from iDCs culture. Lysates and TCM used in these analyses were collected from cultures of HCT116 and HT29 CRC lines expanded in adherent or spherical forms (allogenic), and CRC patients-derived CSCs (autologous). Bars represent median value (*p < 0.05 vs iDCs, •p < 0.05 lysate vs lysate/LPS or TCM vs TCM/LPS, #p < 0.05 vs LPS; ANOVA Kruskal – Wallis test, n = 15).

