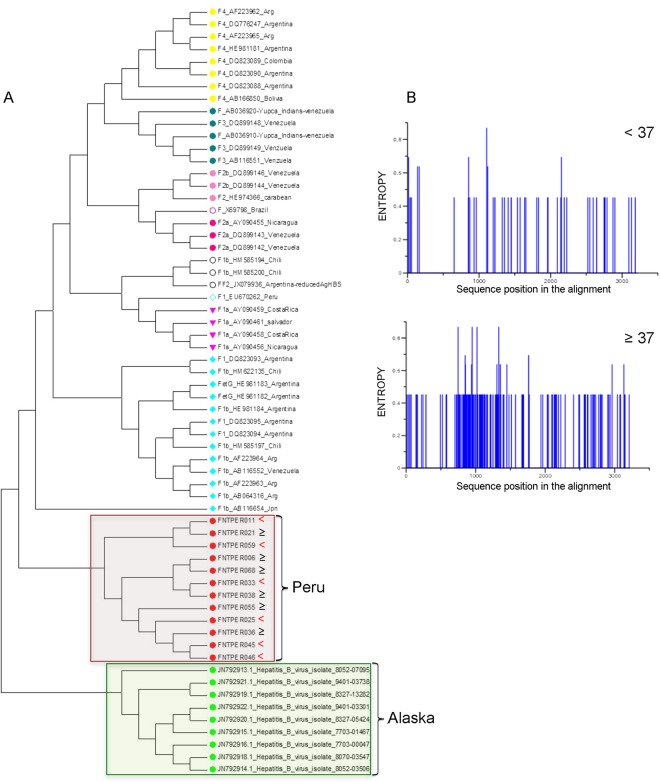
Figure 3.
Phylogenic analysis of the full HBV genomes. (A) Phylogenic tree construction displaying clustering of various genotype F strains. Red dots correspond to HBV isolates assembled for the present study; all of them were clustered within the sub-genotype F1b. (B) Shannon entropy diagram of the 12 HBV isolates from Peruvian patients below (n = 6) (upper panel) and above age 37 (n = 6) (lower panel). Presence of blue lines indicates nucleotide diversity at corresponding position.

