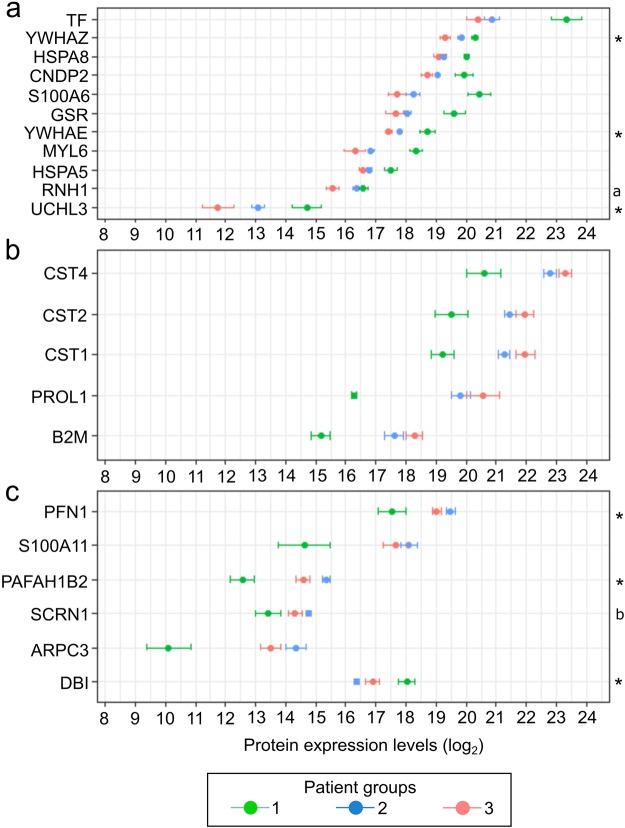
Figure 2.
Proteins (y-axis) with differing baseline log2 expressions (x-axis) between the patient groups. Protein expression of several pro-inflammatory proteins is highest at baseline for patients in group 1, intermediate in group 2, and lowest in group 3 (a). Protein expression levels of various cystatins, proline-rich protein 1 (PROL1), and beta-2-microglobulin (B2M), considered to be beneficial, are lowest for group 1 patients, intermediate in group 2, and highest in group 3 (b). A collection of proteins not following the same order as in A and B (c). Measures are shown as mean ± s.e.m. and all proteins missing a specification (*, a or b) have a statistical difference between patient groups 1 and 2, and 1 and 3 (Welch’s analysis of variance). *Significant differences between all patient groups; aPatient group 3 differs significantly from other groups; bPatient groups 1 and 2 differ from each other significantly.

