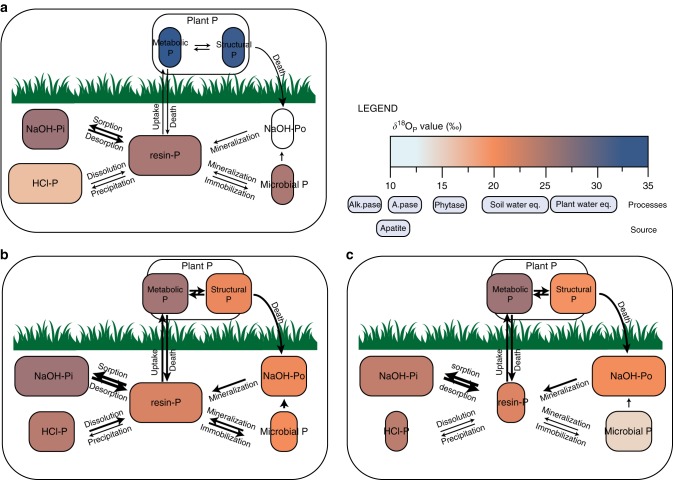
Fig. 5.
Phosphorus cycling in three different climatic zones. For each climatic zone, arid (a), subhumid (b), and humid (c), the size of boxes represents the relative size of the pool and the size of arrows represents the relative importance of the respective flux. Pool colors correspond to δ18OP values. We assumed four process signals: first, weathering of primary apatite with a δ18OP of 10‰; second, equilibration with water by pyrophosphatase in soil microbes (18–25‰); third, mineralization of organic P by hydrolyzing enzymes (7–17‰, depending on the enzyme), and fourth release of plant P (23–35‰) (Supplementary Tables 4 and 5). At arid sites, δ18OP of soil NaOH-Po could not be measured due to small concentrations

