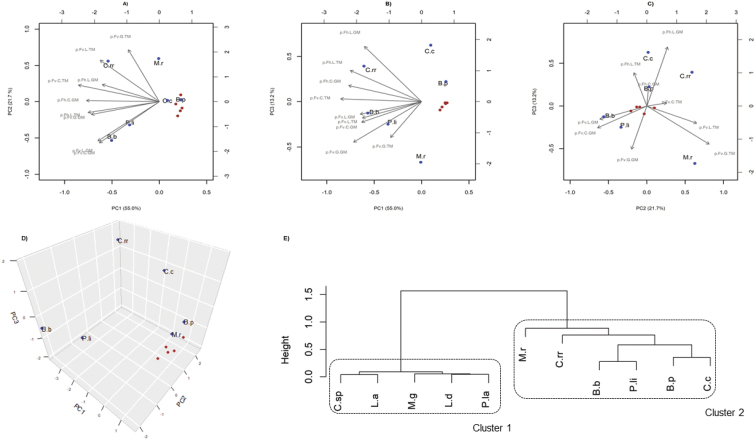
Figure 3.
Principal component analysis (PCA) and hierarchical clustering of the observations based on the fungal isolations. aPC1 vs. PC2. bPC1 vs. PC3. cPC2 vs. PC3. d PCA 3D plot e Hierarchical clustering dendrogram to access the ecological proximities of obtained fungi based on their respective isolation profiles. Software R 4.3.2 was used to obtain the PCA plots and the hierarchical clustering. There was no fungal isolation from hedgerows from the farm Granja when bait-insect T.molitor was used and hence, it could not be included in any of the analysis which relies on proportions, i.e. PCA plots, hierarchical clustering. To reduce any bias, the authors also discarded the soil samples (N=1) which yielded the fungal isolations, when G.mellonella was used, from the hedgerows of the farm Granja. The blue balls represent relatively more frequent EPF, i.e. Beauveriabassiana, Beauveriapseudobassiana, Clonostachysroseaf.rosea, Cordycepscicadae, Purpureocilliumlilacinum and Metarhiziumrobertsii. The red balls represent other fungi such as Cordyceps sp., Lecanicilliumaphanocladii, Lecanicilliumdimorphum, Metarhiziumguizhouense and Purpureocilliumlavendulum. Hierarchical clustering based dendrogram classified isolated EPF into two clusters, i.e. rarely occurring EPF (cluster 1) and relatively more frequent EPF (cluster 2). Abbreviations used are: Beauveriabassiana (B.b), Beauveriapseudobassiana (B.p), Cordycepscicadae (C.c), Cordyceps sp. (C.sp), Lecanicilliumaphanocladii (L.a), Lecanicilliumdimorphum (L.d), Metarhiziumguizhouense (M.g), Purpureocilliumlavendulum (P.la), Purpureocilliumlilacinum (P.l), Clonostachysroseaf.rosea (C.rr) and Metarhiziumrobertsii (M.r).

