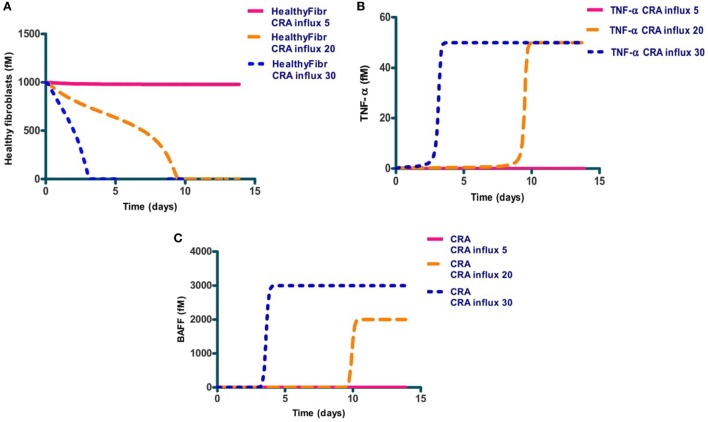
Figure 3.
The levels of three network components involved in inflammation, i.e., healthy fibroblasts (A), TNF-α (B), and antigen (CRA) (C) as functions of time after increasing (at time 0) the CRA influx level. Full line: no increase in CRA influx, i.e., maintained at 5.0 fM/min. Yellow dashed line: CRA influx increased from 5 to 20 fM/min. The blue dotted line: CRA influx increased from 5 to 30 fM/min.

