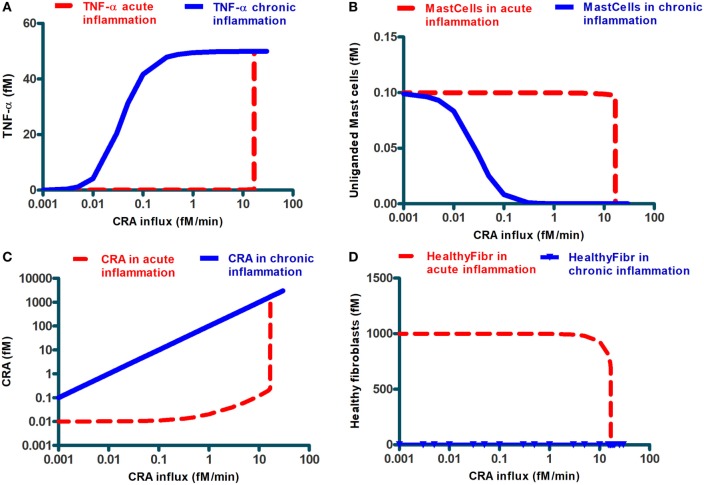
Figure 4.
Steady-state levels of various network components at the final steady state achieved when starting from an initial state at very low CRA influx (dashed lines; we call this “acute inflammation”) or starting from an initial state at very high CRA influx (full lines; we call this “chronic inflammation”). The former cases were calculated by starting at a steady state at 0.001 fM/min CRA influx and then increasing that influx to the level indicated on the abscissa. The latter cases were computed by starting at the steady state achieved for 30.0 fM/min CRA influx and by then reducing the CRA influx to the rate indicated on the abscissa (where steady-state concentrations were below 10–9, which was the resolution of COPASI computation, MMP7 and MMP8, healthy and dying fibroblasts, we reset them to 10–9 fM). The components are, as indicated, (A) TNF-α, (B) unliganded mast cells, (C) CRA, and (D) healthy fibroblasts. The symbols in (D) refer to the CRA values for which actual calculations were carried out. In all figures, lines in between were obtained by linear interpolation between calculated points.

