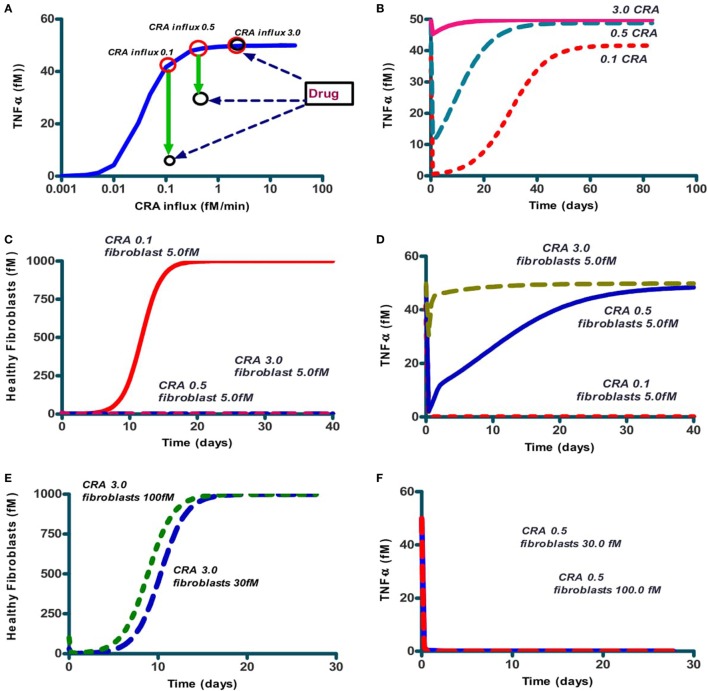
Figure 5.
The effect on steady-state TNF-α levels and number of healthy fibroblasts of addition of IgLC-binding peptide to a chronically inflamed network at various sustained rates of CRA influx. (A) The full line (blue; also in Figure 4A) represents the steady-state TNF-α levels when no peptide was added; the system had first been brought to the CRA influx steady state of 30 fM/min after which the CRA influx rate was reduced to the number indicated on the abscissa. This produced the chronic inflammation state even for the lower CRA influx rates. The red circles indicate these original chronic inflammation states at CRA influx rates of 0.1, 0.5, and 3.0 fM/min. The downward green arrows to the black circles show the effect after 15 simulated days, of then adding 1 nM of IgLC-binding peptide at sustained CRA influx rates of 0.1, 0.5, or 3 fM/min. (B) The time dependence of TNF-α after peptide addition to any of these three chronic inflammation states, i.e., at CRA influxes of 0.1, 0.5, and 3 fM/min. (C) The effect on fibroblast levels of 5.0 fM fibroblast addition to the system at steady state simultaneously with peptide addition, of the 0.1 (full red line), 0.5 (dashed blue line), and 3.0 (dashed red line) fM CRA/min chronic states as in (A). (D) The effect on TNF-α levels of 5 fM fibroblasts added to the system at steady state simultaneously with drug treatment of the CRA influx of 0.1 (dashed red line), 0.5 (blue full line), and 3.0 (dashed green line). (E) Fibroblast concentration as function of time after injecting 6 times (dashed line) or 20 times (dotted line) more healthy fibroblasts to the chronic 3.0 fM CRA/min state. (F) The effect on TNF-α levels of giving 30 or 100 fM fibroblasts to the system at steady state simultaneously with peptide treatment at CRA influx rates of 0.5 (red dotted line), 3.0 fM/min (blue full line, coinciding with axes).

