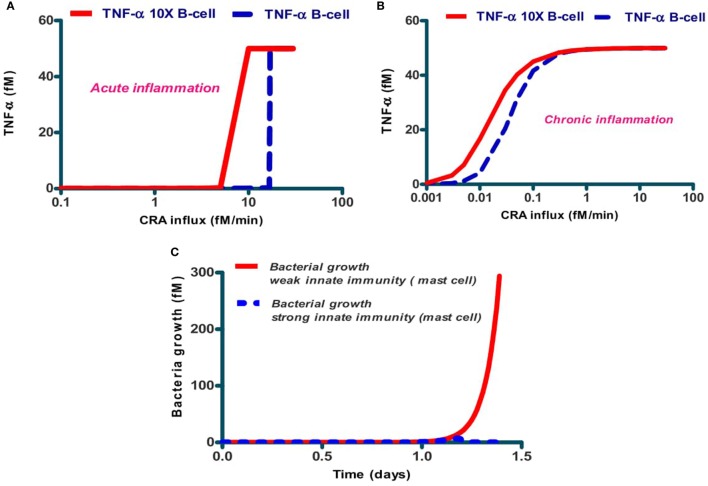
Figure 7.
Dependence of acute (A) and chronic (B) inflammation on the rate of CRA influx and in bacterial infection (C) depends on the individual's B-cell level. The dashed lines in (A,B) refer to the standard case, while the full lines refer to the same calculations but for five times increased B-cell levels. (C) Dependence of host response in silico on the level of mast cells. The full red line refers to the standard case with 0.1 fM of mast cells, and the dashed blue line (almost coinciding with the abscissa) to the case with 1 fM of mast cells. Protease secretion rate constant for mast cells was k25 = 65/min and B-cell concentration was 1 fM in both cases.

