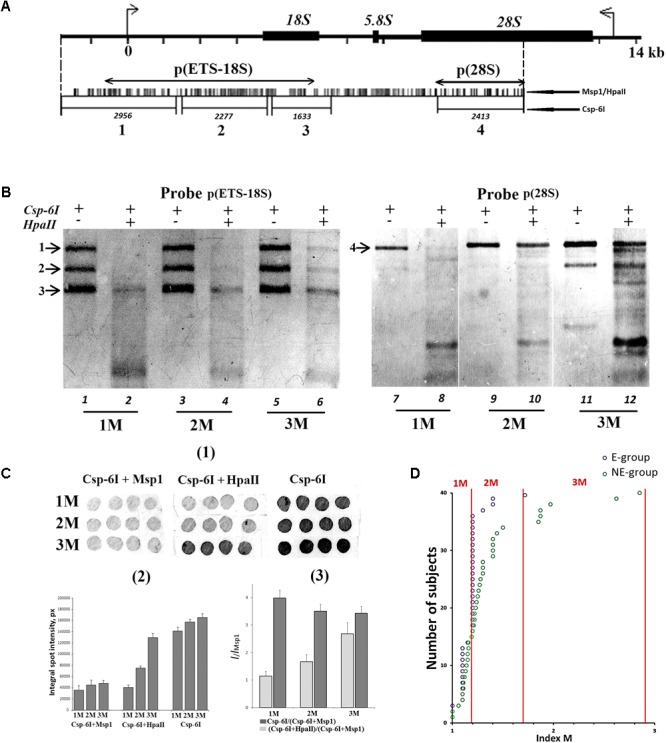
FIGURE 3.

(A) A scheme of the human ribosomal repeat. Positions of sites for Msp1/HpaII and Csp-6I endonucleases are shown. The major rDNA fragments (1–4) are shown, which are formed due to cleavage by Csp-6I and detected with biotinylated probes p(ETS-18S) and p(28S). The fragment length is presented in base pairs (bp). (B) Examples of non-radioactive Southern blot analysis of three DNA samples with different quantities of hypermethylated rDNA copies in the genomes are demonstrated. Fragments 1–4 are shown. Samples that belong to 1M demonstrate no bands corresponding to fragments 1 and 2. In samples that belong to 3M, all the bands corresponding to fragments 1–4 can be clearly seen. (C) Examples of the use of NQH technique for the determination of rDNA methylation index (M). (1) An example of hybridization of DNA hydrolyzates containing various amounts of hypermethylated rDNA copies in the genome with the biotinylated probe p(ETS-18S). (2) Values of integral intensity of the hybridization signal (means for four dots and standard deviations are shown). (3) Ratio of integral intensities of signals (Csp-6I + HpaII) and (Csp-6I + Msp1) hydrolyzates (methylation index M). For comparison, ratio of integral intensities of signals (Csp-6I) and (Csp6I + Msp1) hydrolyzates is shown. (D) The number of DNA samples containing rDNA copies methylated by types 1M–3M in the samples belonging to E-group (N = 40, aged 80–91 years) and NE-group (N = 40, aged 17–60 years). Ranges of methylation index M for each methylation group are indicated in the figure. Each value of the index M represents the average of three independent experiments.
