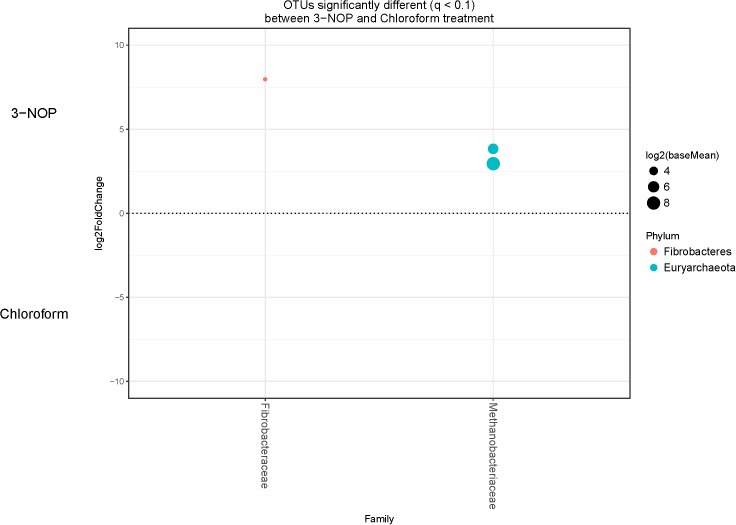
FIGURE 3.
OTUs significantly different (q < 0.1 FDR) between 3-NOP and chloroform treated-steers. Upper axis represents OTU’s with a log2 fold positive difference for 3-NOP treatment relative to chloroform while the lower y-axis is the negative fold difference of the 3-NOP relative to chloroform. Each point represents a single OTU colored by phylum and grouped on the x-axis by taxonomic family level, size of point reflects the log2 mean abundance of the sequence data.

