Figure 6.
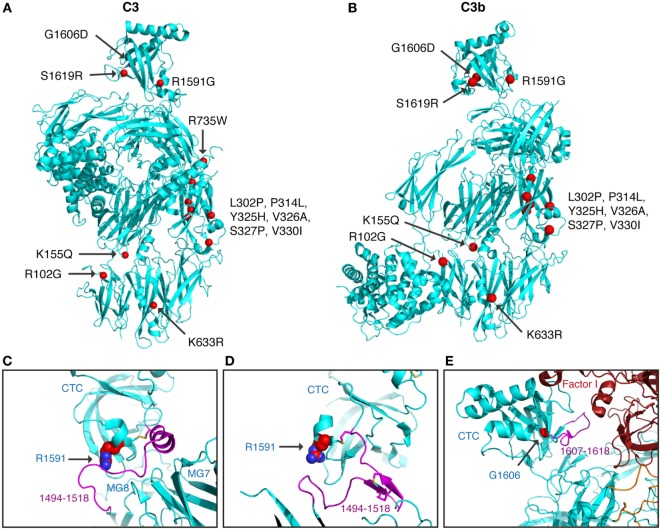
Structural analysis of C3 alterations. The C3 alterations analyzed in this study were mapped onto the (A) C3 (pdb-id: 2A73) and (B) C3b (pdb-id: 5FO7) structures, using the molecular graphics program PyMOL. R735W is located in C3a and therefore absent in the C3b molecule. For R1591G; structures are shown of (C) C3 (pdb-id: 2A73) and (D) C3b (pdb-id: 5FO7). Both C3 and C3b are colored in cyan with indicated in purple the neck region (res. 1494–1518), connecting the CTC domains to the C3 and C3b body. R1591 is indicated by spheres and disulfide bridge Cys1518–Cys1590 shown in sticks. (E) For G1606D; the structure of C3b—mini-factor H—factor I (pdb-id: 5O32) is shown. The glycine C[alpha] atom is indicated by a red sphere. Mutation G1606D likely induces local rearrangement affecting its subsequent loop (res. 1617–1618, highlighted in purple) that is directly involved in contacting factor I.

