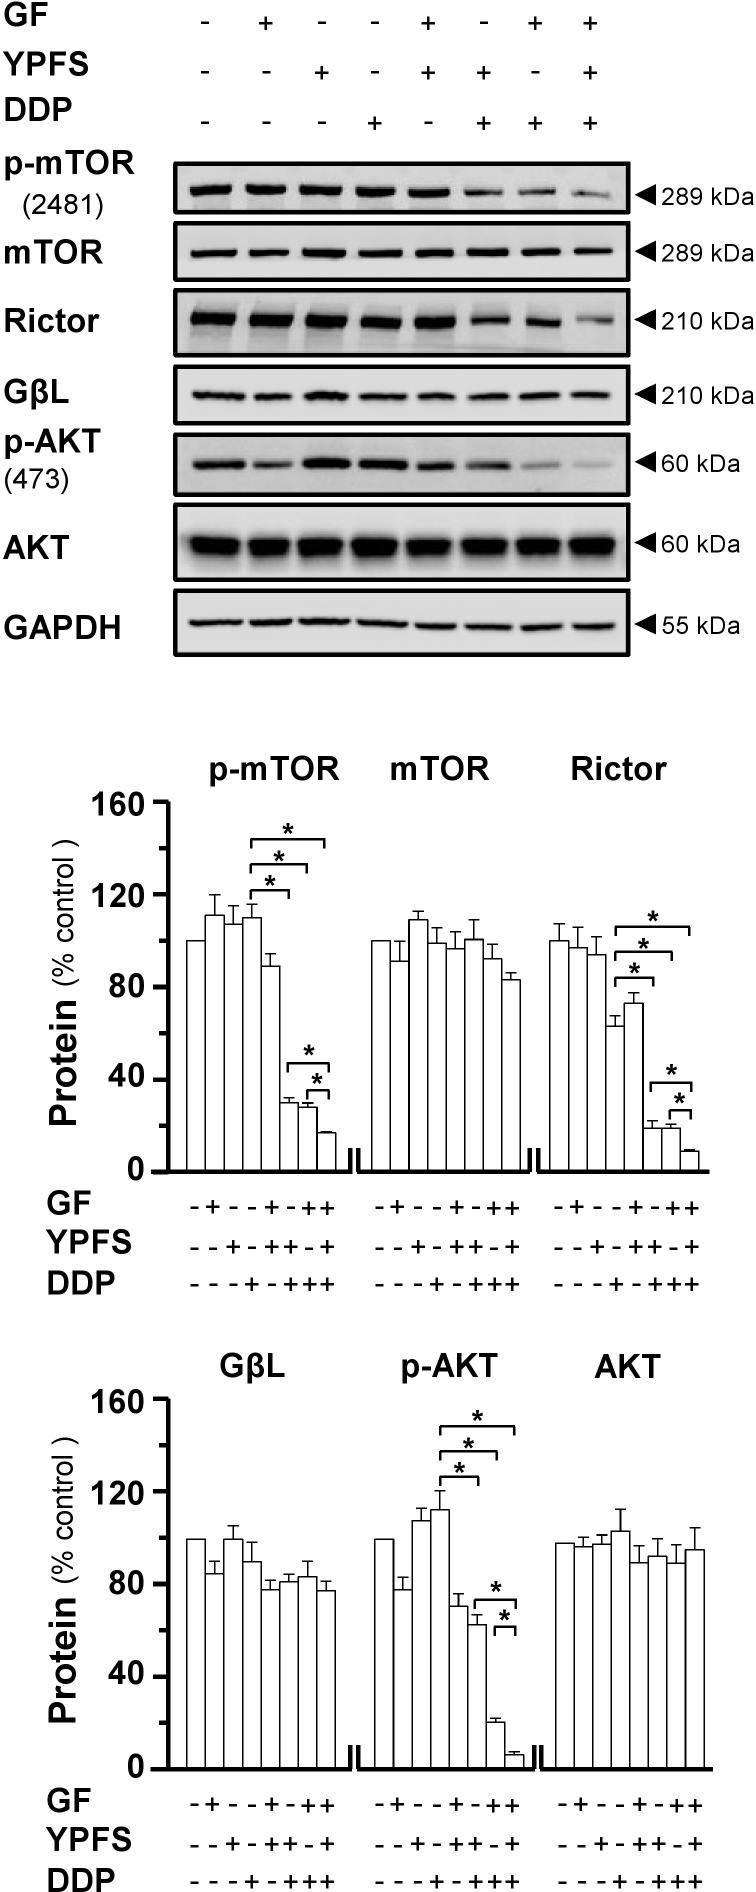
FIGURE 5.
YPFS+GF disrupts mTORC2 complex in A549/DDP cells. Cultured A549/DDP cells were treated with DDP, YPFS, GF, YPFS+GF, and DDP with or without YPFS, GF or YPFS+GF for 48 h, as in Figure 4. Western blot was applied to analyze the amount of p-mTOR (∼289 kDa), mTOR (∼289 kDa), Rictor (∼210 kDa), GβL (∼37 kDa), p-AKT (∼60 kDa), and AKT (∼60 kDa) (upper panel). Expression of GAPDH (∼37 kDa) served as a control. Quantitation of protein expression is shown in lower panel. n = 3. ∗p < 0.05.

