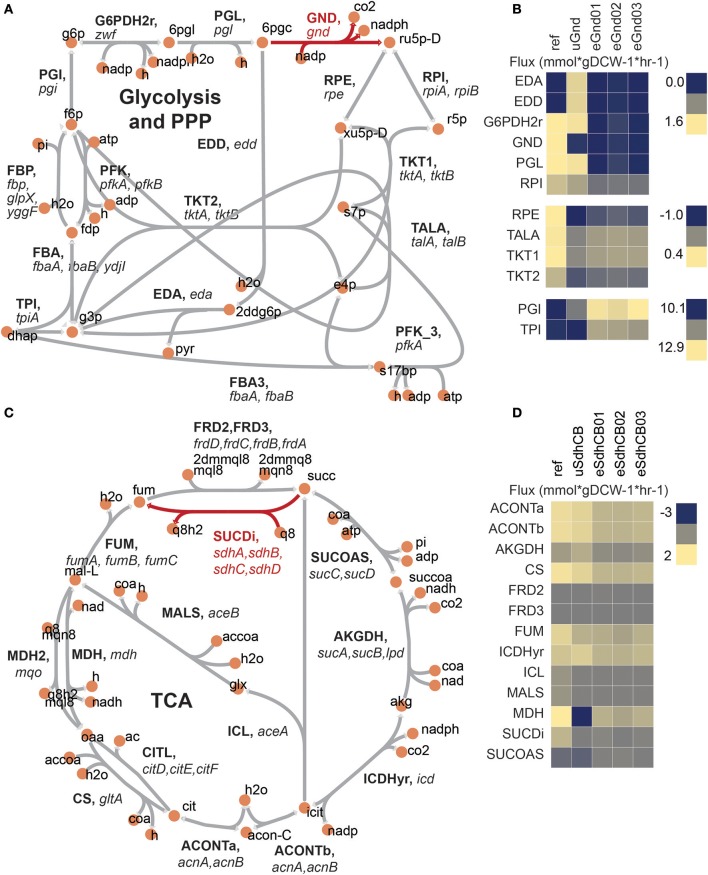
Figure 2.
Flux maps of gnd and sdhCB knockout strains at the vicinity of the network perturbation. (A) Network diagram of upper glycolysis, the oxidative pentose phosphate pathway (oxPPP), and the non oxidative pentose phosphate pathway (nonOxPPP). The KO reaction is highlighted in red. (B) Measured fluxes for Ref, uGnd, and eGnd strains. (C) Network diagram of the TCA cycle. The KO reaction is highlighted in red. (D) Measured fluxes for Ref, uSdhCB, and eSdhCB. All reaction and metabolite identifications shown are based on the iJO1366 model of E. coli.

