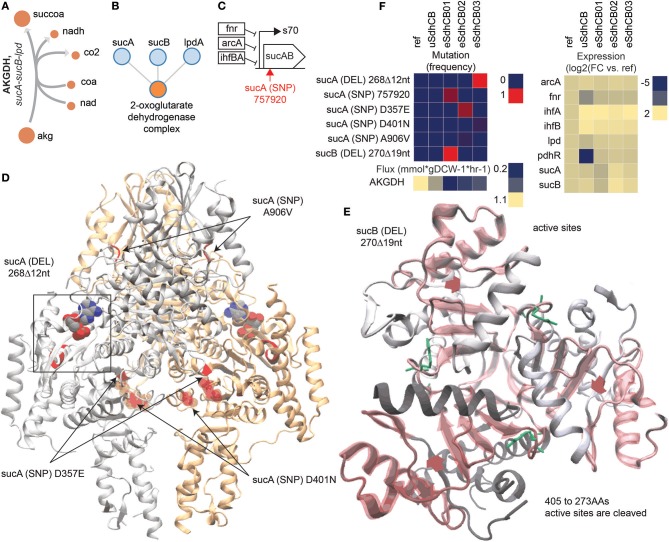
Figure 8.
Mutations that affect 2-oxoglutarate Dehydrogenase (AKGDH) enzymatic activity and expression in eSdhCB strains. (A) Network diagram of the AKGDH reaction. (B) Protein-protein binding diagram of the 2-oxoglutarate Dehydrogenase complex formation. (C) Operon diagram of the sucAB operon. The position of the intergenic mutation is highlighted in red. Gene expression of sucAB in eSdhCB01 is significantly depressed compared to all other strains, most likely due to the intergenic mutation (Table S4). In contrast, sucAB is upregulated in eSdhCB02/03 compared to uSdhCB (Table S4). (D) Crystal structure of SucA. Mutations are highlighted in Red. A substrate analog is shown. The deletion (DEL) mutation in eSdhCB03 occurred at residues that affect substrate binding. The sucA D357E, A906V, and D40N SNPs all occur near homodimer interface regions. (E) Crystal structure of SucB. Mutations are highlighted in red. Cleaved regions are outlined in red. Substrate binding residues are highlighted in green. The DEL mutation cleaved residues 405–273, which are all in the active site. (F) Mutation frequency, gene expression levels, and flux of components involved in the AKGDH reaction. Note the reduced flux through AKGDH in all eSdhCB strains.

