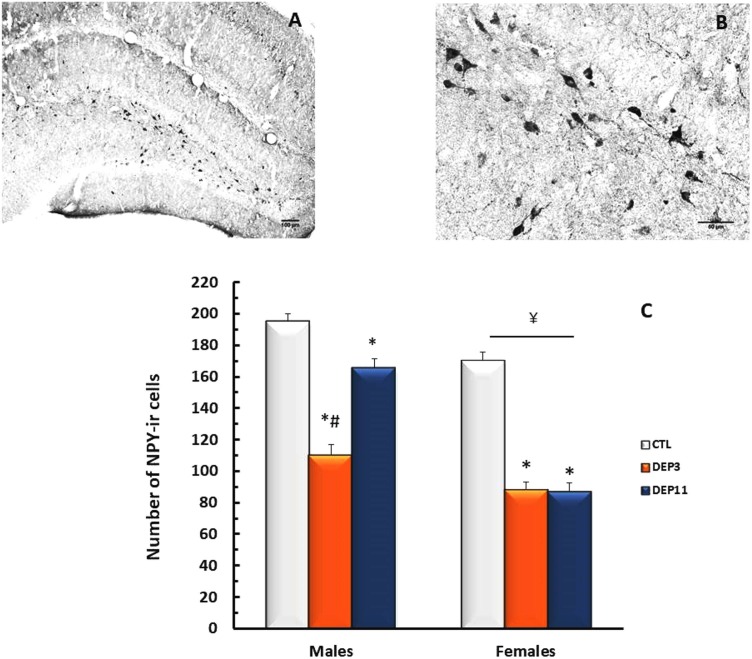
FIGURE 6.
Photomicrograph of the dorsal hippocampus (dHPC) of one control rat at 10x (A) and 40x magnification (B). Number of NPY-immunoreactive neurons in the dHPC (C) of animals maintained with their mothers (CTL), deprived on postnatal day (PND) 3 (DEP3) or on PND 11 (DEP11) and perfused between PNDs 52 and 60. Data are presented as mean ± SEM of 11–15 males and 10–11 females/group. Scale bar in A = 100 μm; scale bar in B = 50 μm. ∗ – Different from CTL group; # – different from DEP11; ¥ – different from respective male group.

