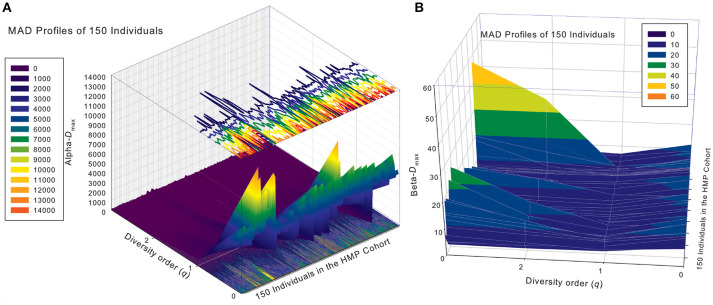
Figure 5.
The alpha-MAD profiles (A) and beta-MAD profiles (B) of 150 individuals in the HMP cohort: x-axis should be the subject ID of the individuals in the HMP cohort but omitted to avoid overcrowded labeling, y-axis is the diversity order (q = 0–3), and z-axis is the alpha- or beta-Dmax corresponding to each diversity order (q: y-axis) of each individual (x-axis). In the case of alpha-MAD (A), along the diversity order (q) axis, each individual has a monotonically decreasing curve (fold lines). In contrast, in the case of beta-MAD (B), the fold lines are valley-shaped.

