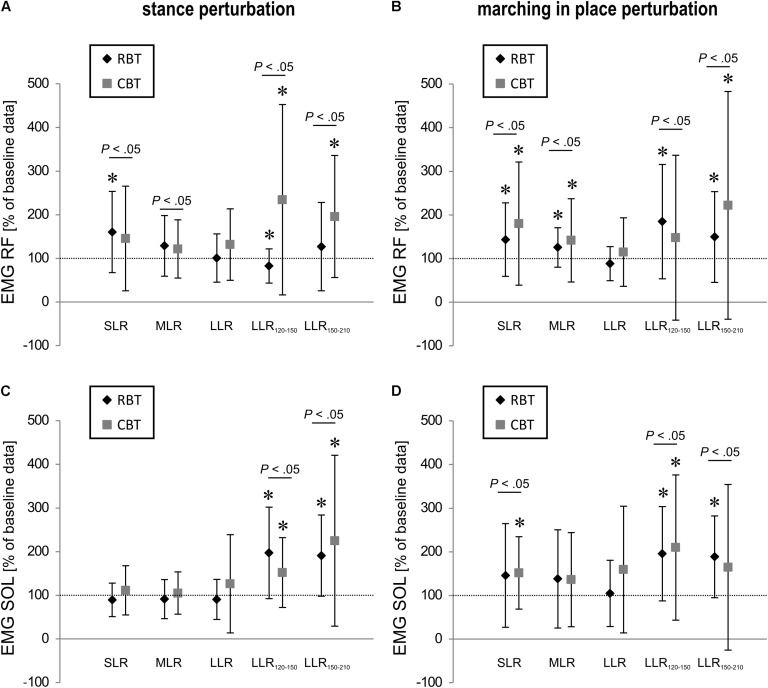
FIGURE 3.
Neuromuscular data of leg muscle activity. Changes of iEMG (in %) of the RF and soleus (SOL) muscles in the short- (SLR), medium- (MLR), LLR as well as 120–150 ms (LLR120-150) and 150–210 ms (LLR150-210) after stance perturbation (A,C) and after marching in place perturbation (B,D) are shown. Data are normalized to baseline values (the horizontal dashed line marks baseline values obtained before the interventions). Mean values are illustrated for both training groups – the RBT group and the CBT group. Significant pre/post differences are marked with ∗ (Pt < 0.05), while significant time interactions are illustrated with bars (P < 0.05).

