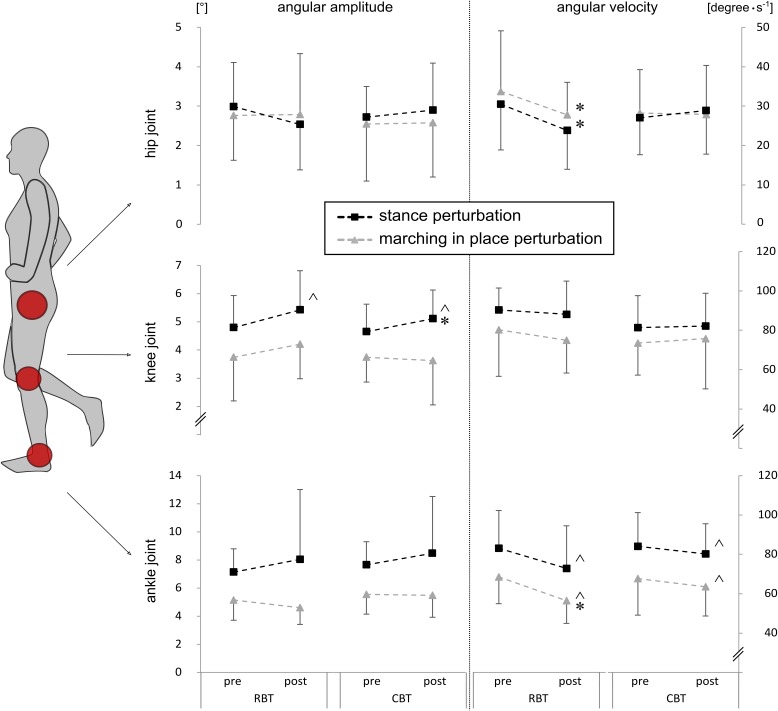
FIGURE 4.
Kinematic data of lower limb joints. Joint kinematics, such as amplitude [°] (left column) and velocity (degrees ⋅ s-1) (right column), for the ankle, knee, and hip joint during stance perturbation (black rectangles, protocol 1) and marching in place perturbation (gray triangles, protocol 2) are shown. Mean values are illustrated for both training groups – the RBT group and the CBT group. Significant time effects are marked with ˆ (P < 0.05) and significant group comparisons (TTESTs) with ∗ (Pt < 0.05).

