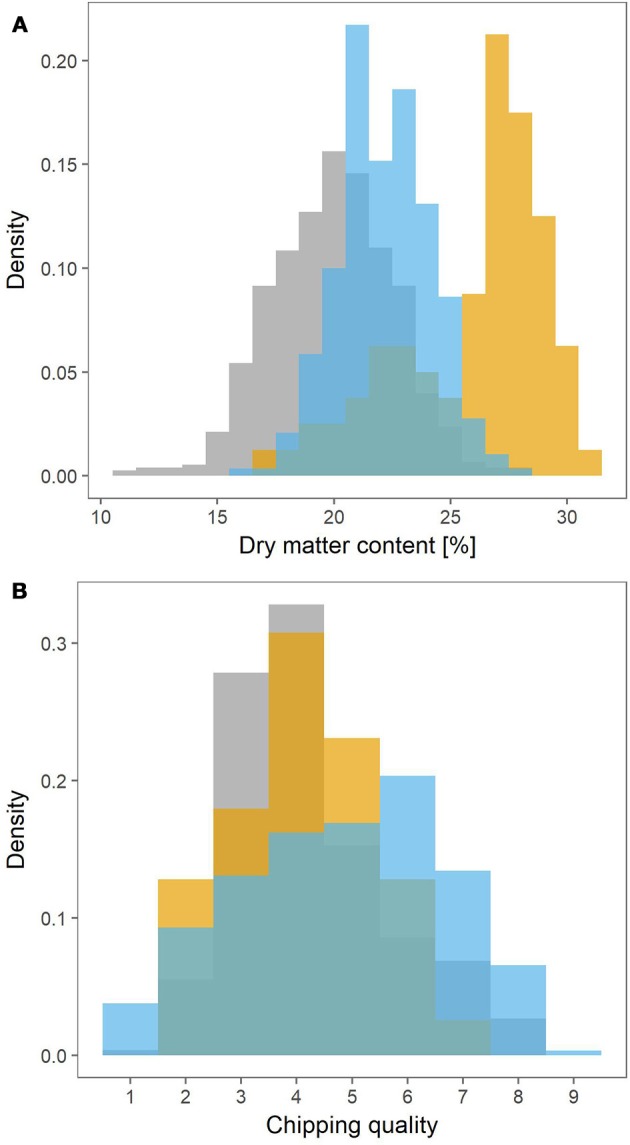
Figure 1.

Density histograms depicting the phenotype distributions for the MASPOT population (gray), Test panel DK (yellow), and Test panel UK (blue). Dry matter content (A) was measured as percentage, while chipping quality (B) was determined as assessment of frying color on a scale from 1 (poor) to 9 (best).
