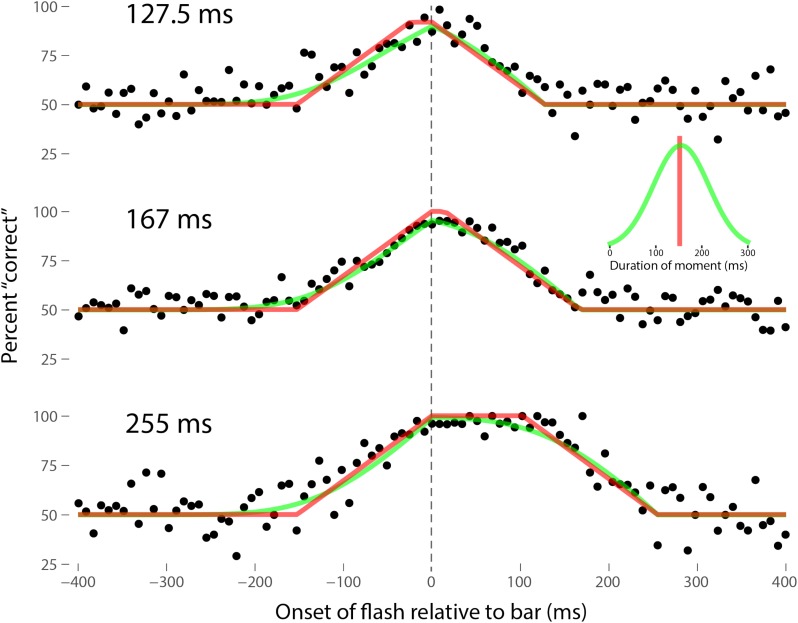
FIGURE 3.
A fit of the discrete perception model to the random flash-lag data (Murakami, 2001). In this study, a bar was randomly displaced ±3° horizontally about fixation every 127.5 (top), 167 (middle), or 255 ms (bottom). An independent brief (8.5 ms) flash occurred every 3 ± 1 s, within ±50’ of fixation. The observers’ task was to report whether the flash occurred to the left or right of fixation. The data above were registered to the onset of the bar. The observers’ responses were scored as “correct” relative to this bar, as opposed to a subsequent or previous bar. The black points are averages from multiple trials for one subject (IM). The red lines are the fit of the single-parameter discrete perception model, linked across the three different bar durations, with D = 152.5 ms for this subject. The green lines indicated the best fit for D with a variable duration, distributed normally, as shown in the inset (μ = 154 ms, σ = 61 ms). The model shows the probability that this bar will be the one present at the end of the perceptual moment, averaged over all of the randomly placed possible phases of the moment.

