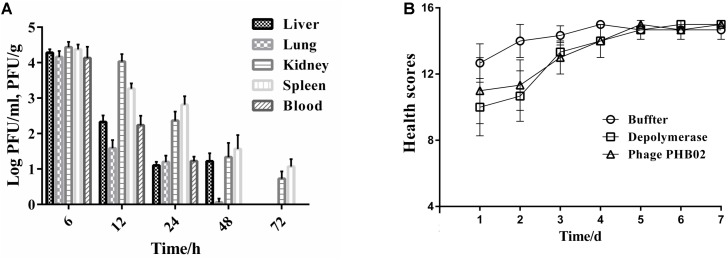
FIGURE 4.
In vivo assays. (A) Distribution of phage PHB02 in mice. The experiment was repeated three times and results are expressed as the mean ± SD. (B) Scores of clinical symptoms post-challenge. The health status of each group of mice was given a score between zero and five, as follows: five: normal health, condition unremarkable; four: decreased physical activity and ruffled fur; three: lethargy and hunched back; two: exudative accumulation around partially closed eyes; one: near death; zero: dead. The total score for each group was recorded at least three times per day. The data are expressed as the mean ± SD.

