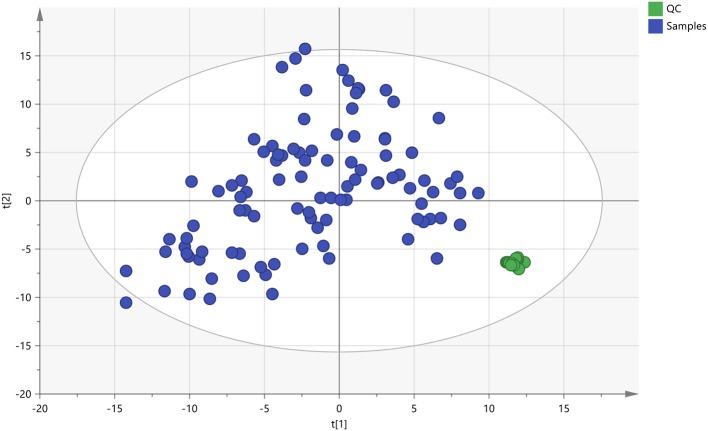
Figure 5.
The PCA scores plot of QC and On-test Samples. Quality control (QC) samples were applied to exhibit the stability of the liquid chromatography-mass spectrometer (LC-MS) system. The cluster of the quality control samples in the principal component analysis scores scatter plot showed a satisfactory stability and repeatability of this lipidomic analysis approach. The colors display the subjects from different groups.  : QC, quality control;
  , Test samples.

