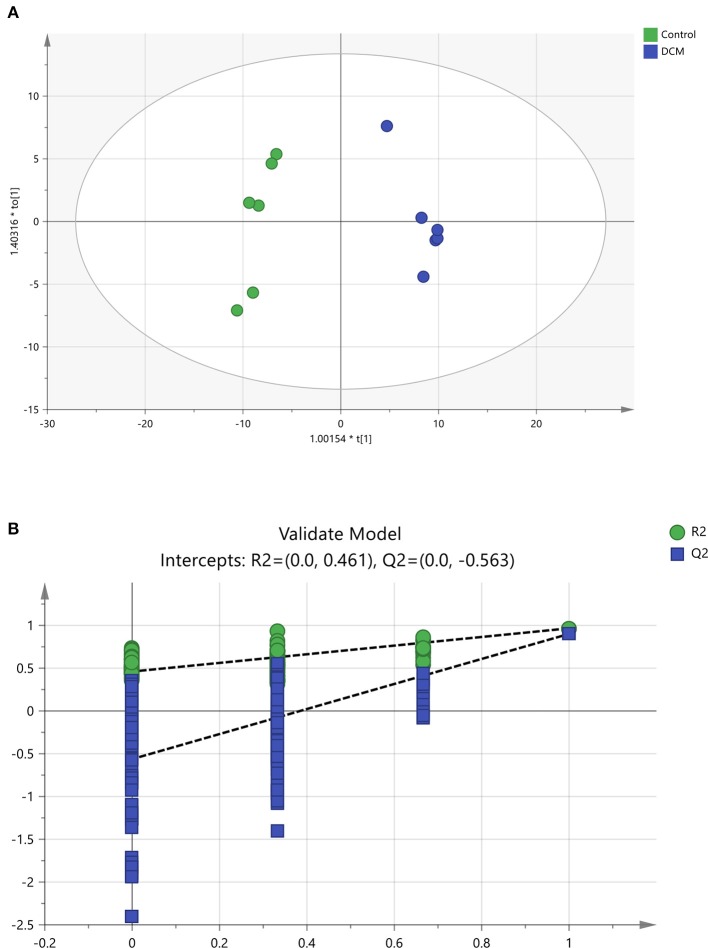
Figure 7.
The OPLS-DA scores scatter plot and validation plot. (A) The orthogonal projection to latent structures discriminant analysis (OPLS-DA) scores scatter plot obtained from the diabetic cardiomyopathy (DCM) group vs. control group. (B) Validation plot for OPLS-DA model. The permutation test was conducted for 200 times to evaluate the risk of over-fitting for the OPLS-DA model. DCM, diabetic cardiomyopathy. (A)
 , Control,
  , DCM model group; (B)
 , R2,
, R2,  , Q2.
, Q2.

