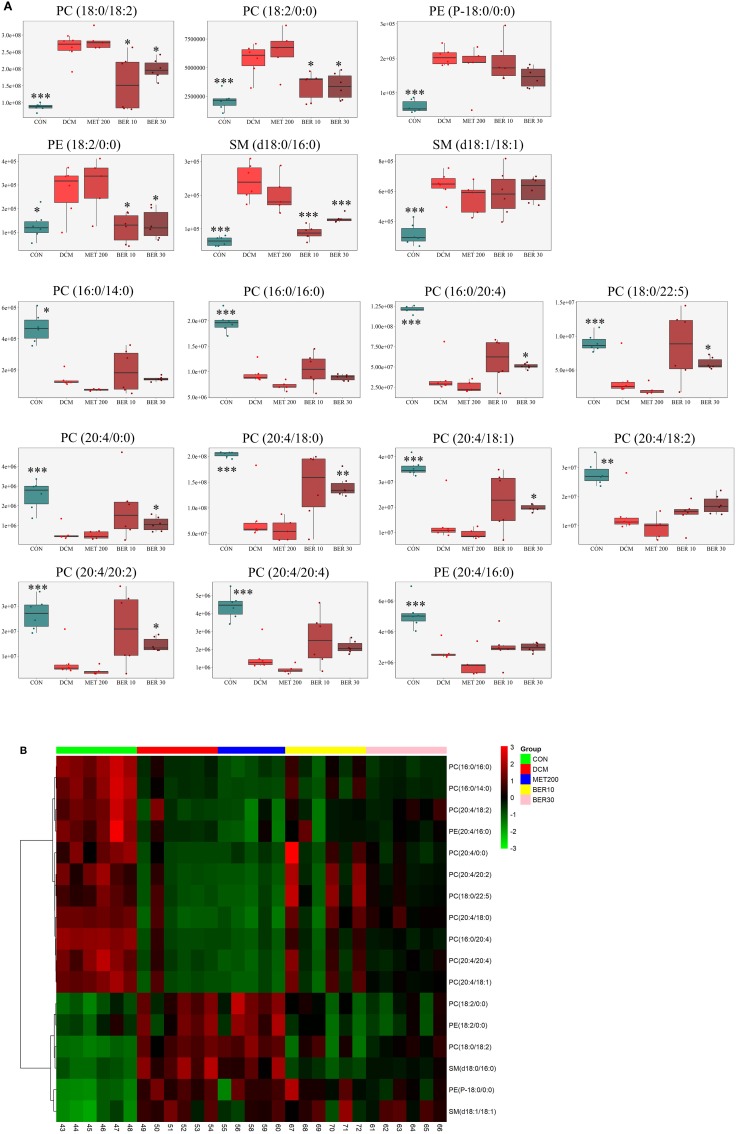
Figure 8.
Identification of potential biomarkers related to diabetic cardiomyopathy development. (A) Metabolic changes of lipids in the five test groups. (B) Heat map. Only metabolites with VIP > 1 and P < 0.05 were selected, and different shades of color present the concentration (red, black, and green presented the high, normal, and low concentration, respectively). CON, control group; DCM, diabetic cardiomyopathy model group; MET 200, DCM + Metformin 200 mg/kg group; BER 10, DCM + Berberine 10 mg/kg group; BER 30, DCM + Berberine 30 mg/kg group; PC, phosphatidylcholine; PE, phosphatidylethanolamine; SM, sphingolipid. Statistical significance was evaluated by one-way ANOVA followed by LSD post-hoc test. *P < 0.05, **P < 0.01, and ***P < 0.001 vs. DCM group.

