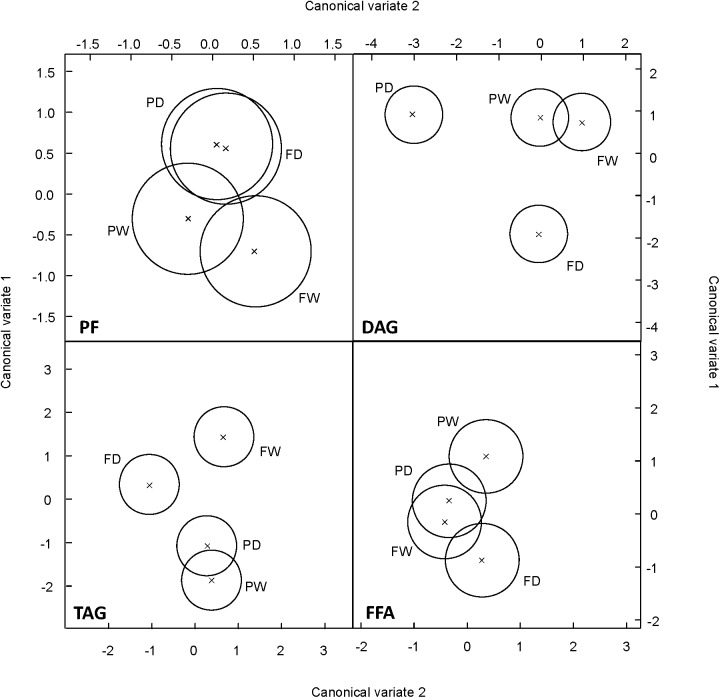
FIGURE 7.
Multivariate analysis of susceptible and resistant oat genotypes according to the different fatty acids assessed. Scatterplot of Canonical variates analysis scores of components 1 and 2 based on the profile of fatty acids within each of the different lipid fractions were performed in drought susceptible Flega and resistant Patones well-watered plants (FW and PW, respectively) and during a time course of water stress (FD and PD, respectively).

