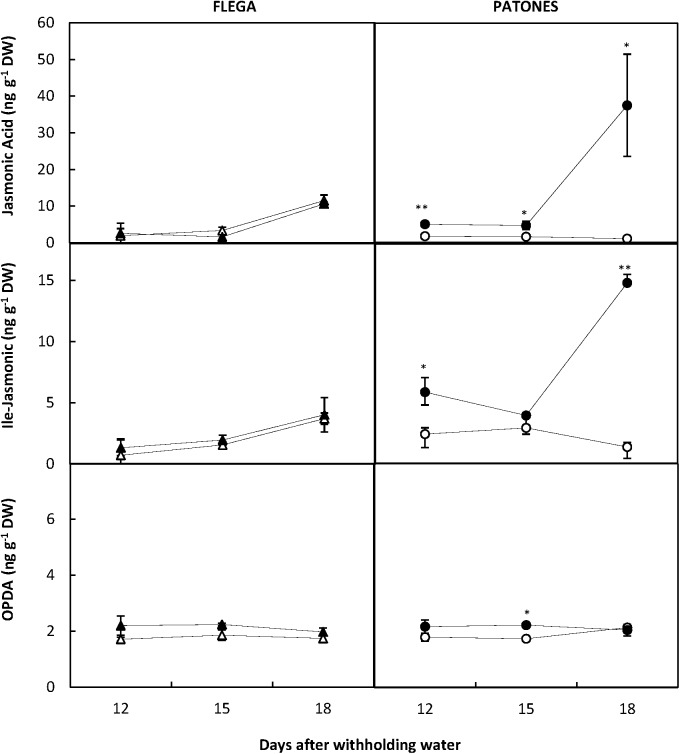
FIGURE 9.
Jasmonate content during a drought time course. Jasmonic acid, Ile-jasmonic and OPDA were quantified in drought susceptible Flega (triangles) and resistant Patones (circles) well-watered plants (open symbols) and during a time course of water stress (solid symbols) (9, 12, 15, and 18 days). Data are mean of five replicates ± standard error. ∗ and ∗∗ indicate significant differences at P < 0.05 and 0.01, respectively.

